
Your source for knowledge, reports, thought leadership, and other tomfoolery. No fluff. No folklore. Just sticky, science-backed brand truth.
The Most ABSurd Blog
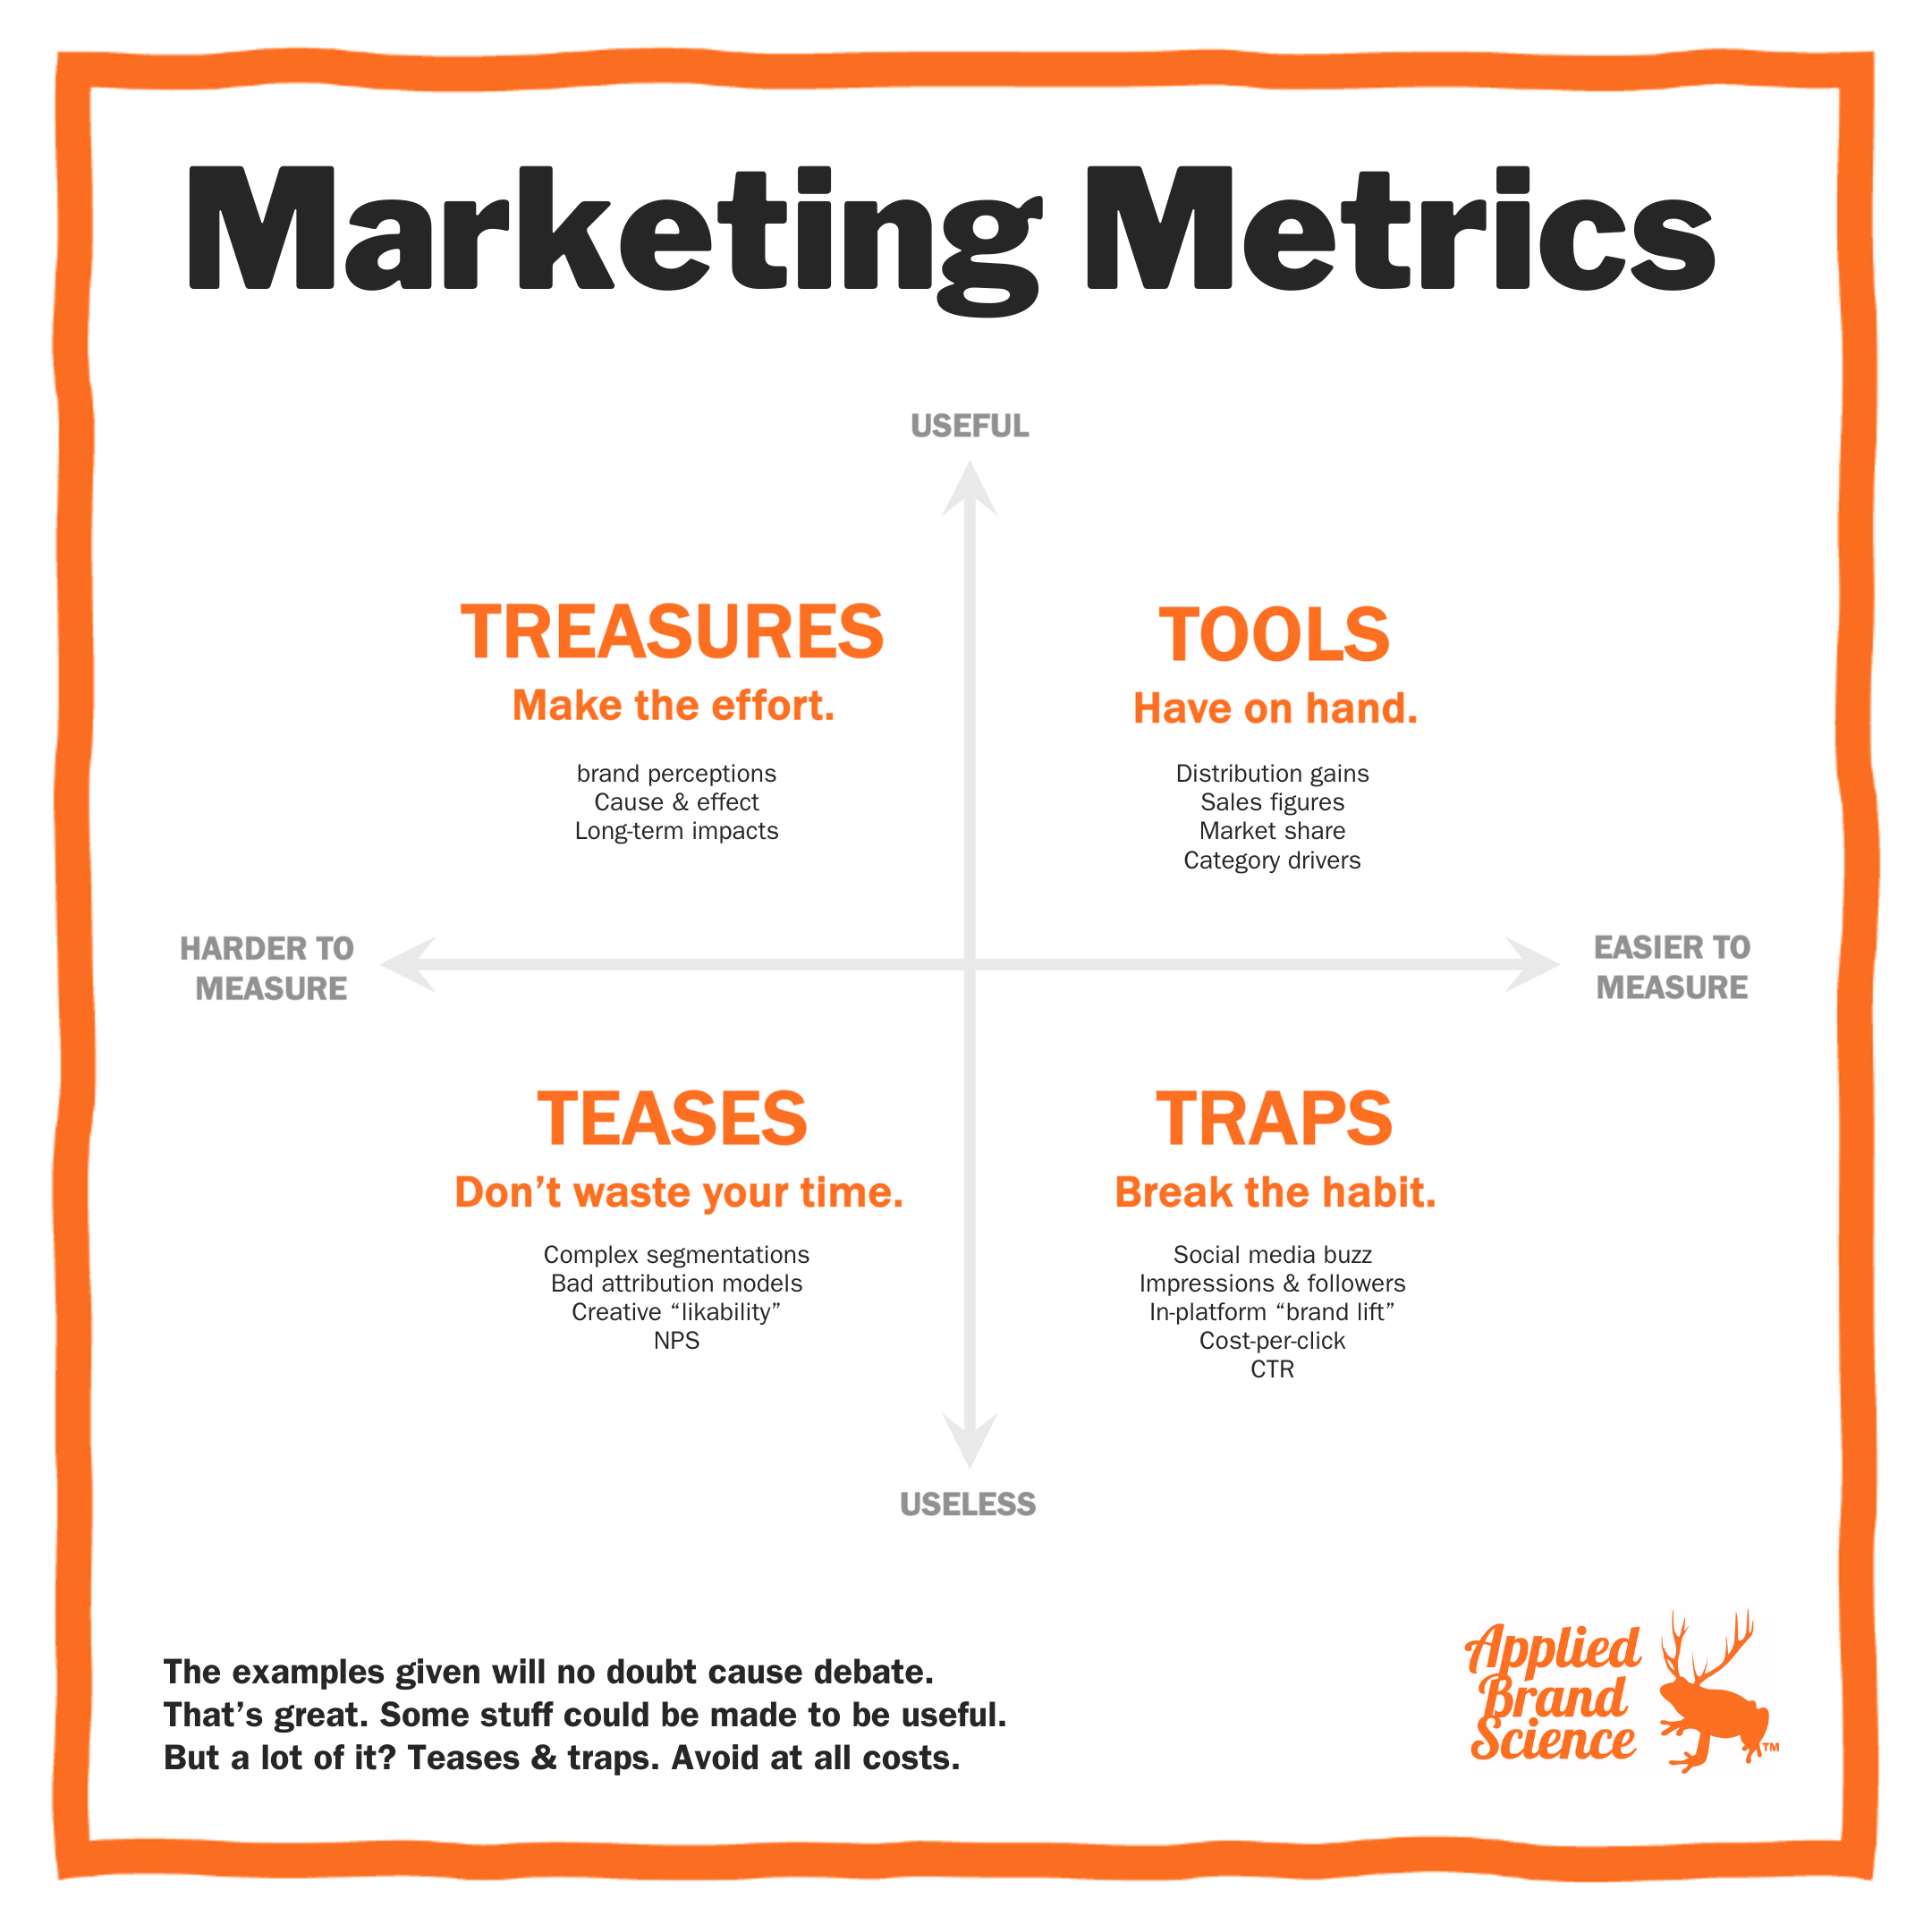
Which metrics are traps, and which are treasures?
With 525,600 marketing metrics out there, here’s the simple way to spot which ones matter—and which are a waste.
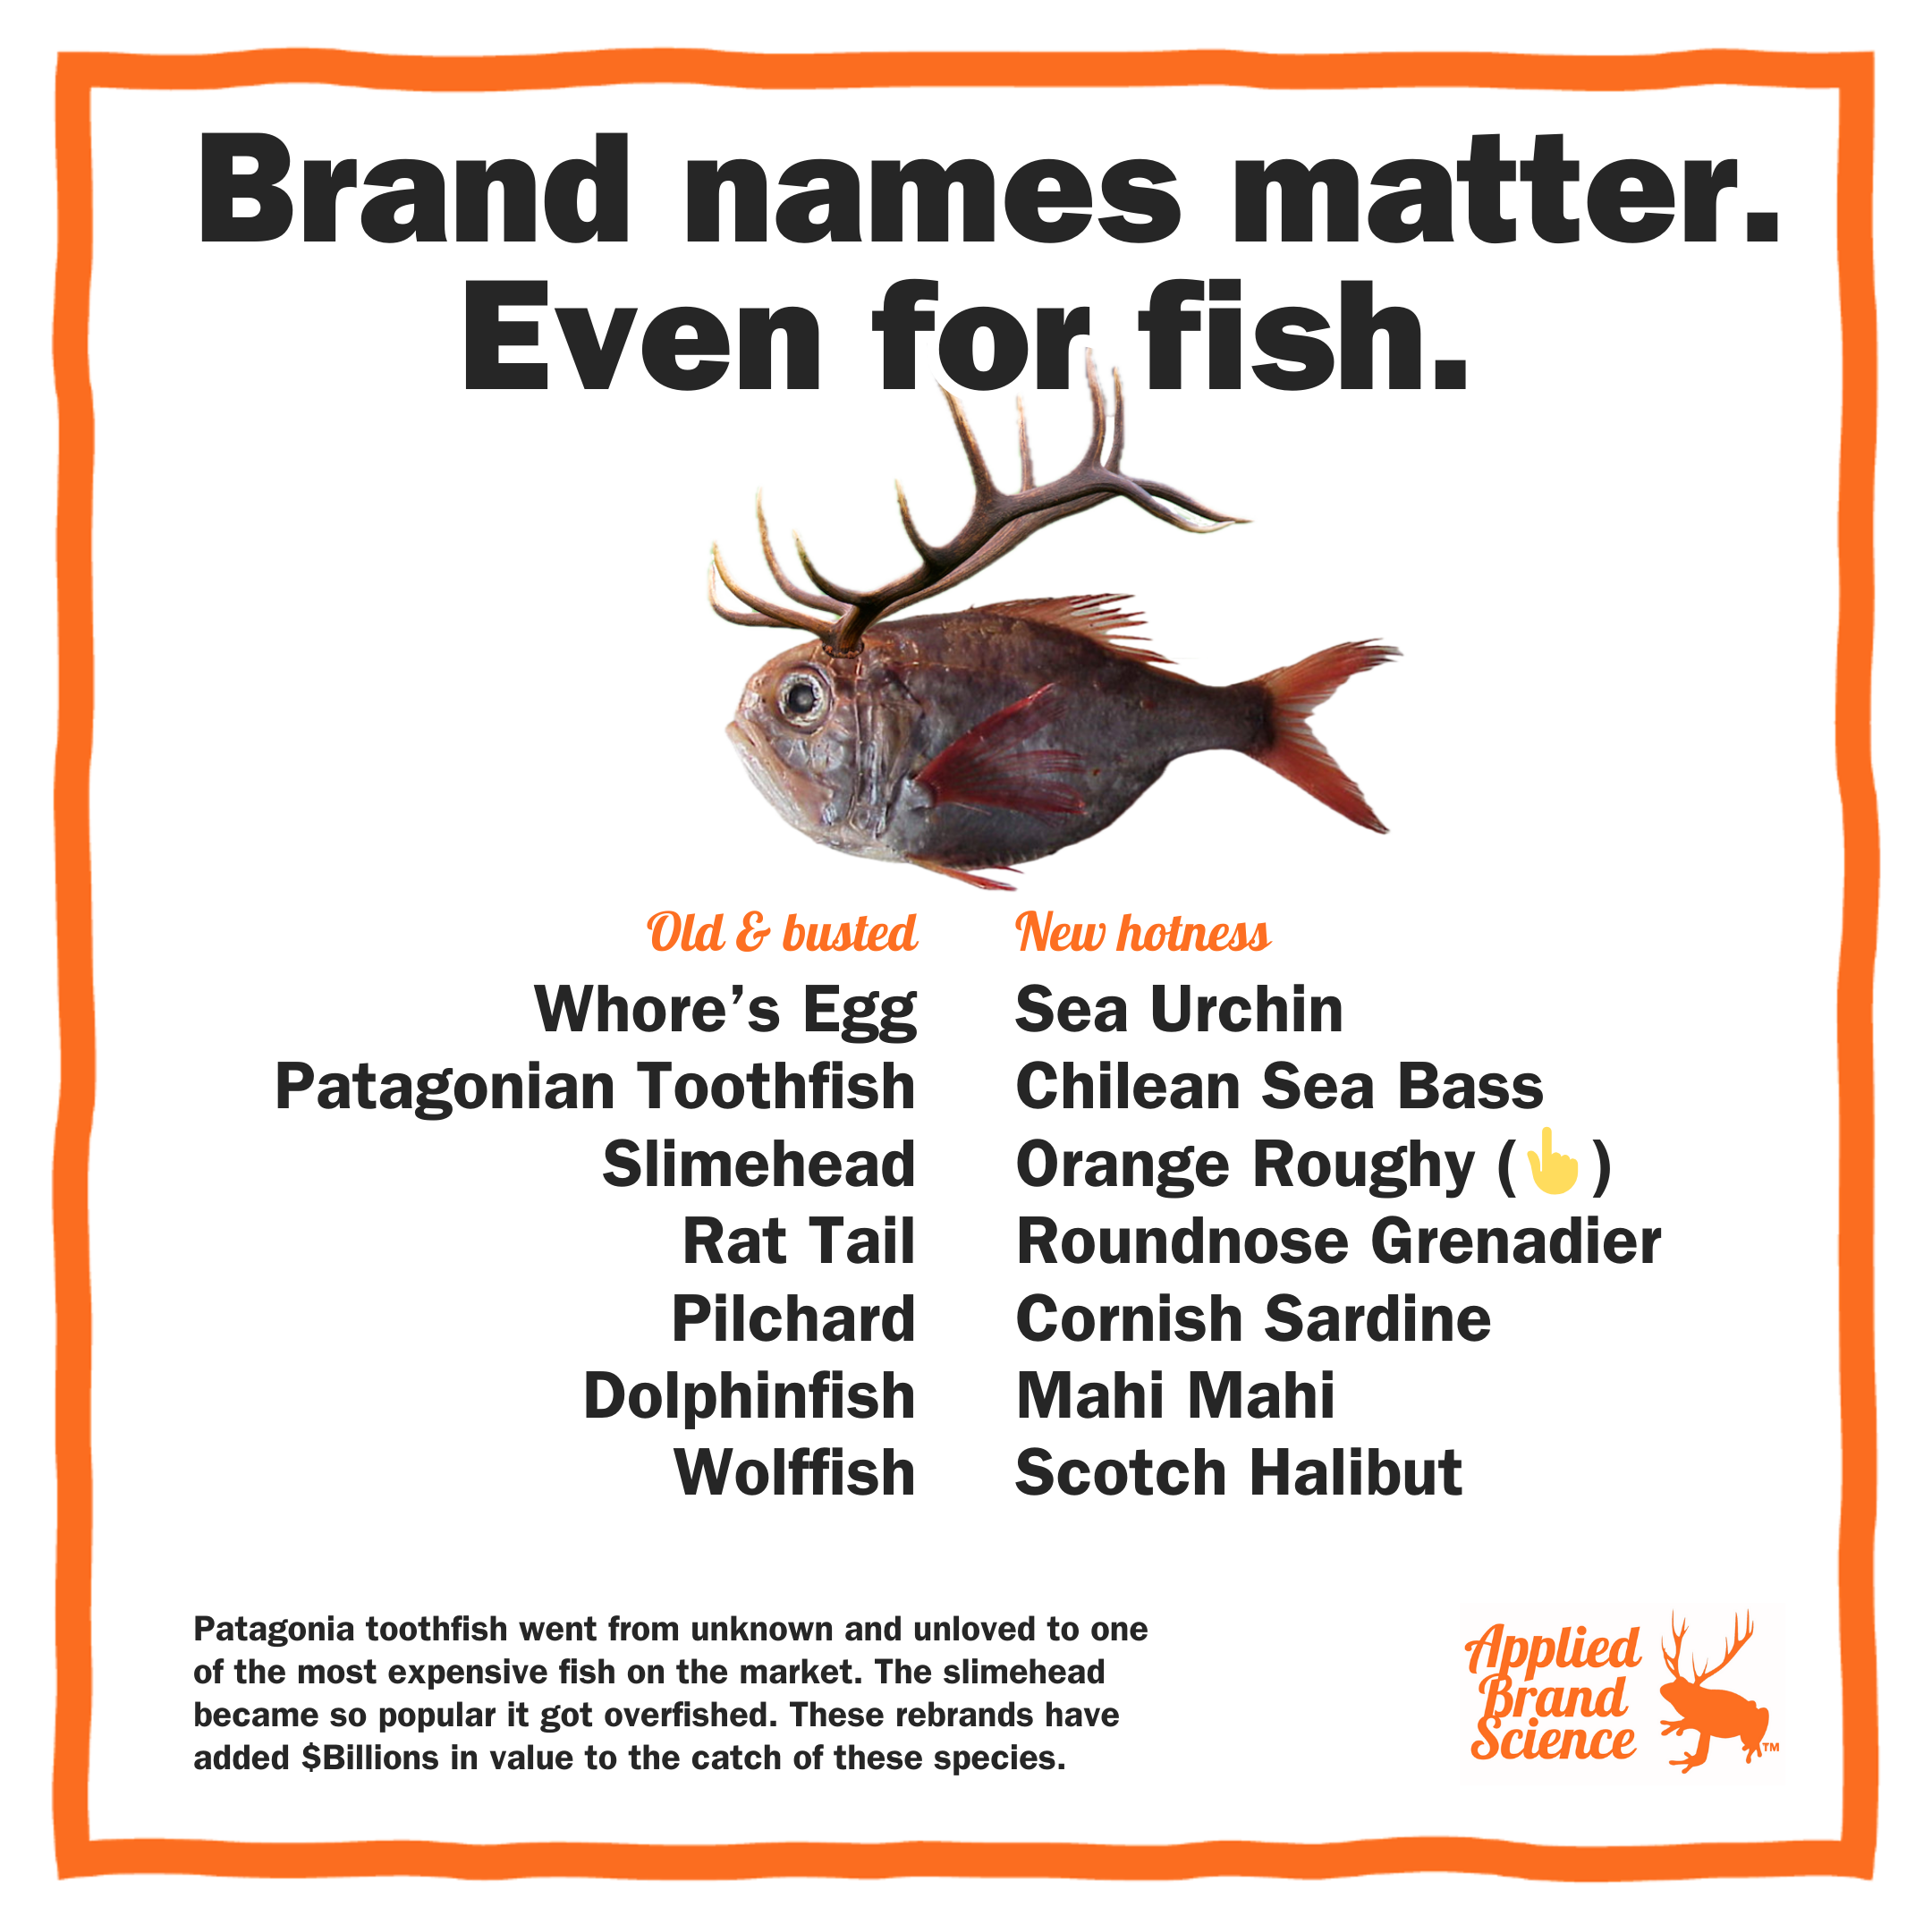
How much can the “brand name” of a fish matter?
If you call a fish ‘slimehead,’ no one buys it—but rename it and suddenly it’s dinner.
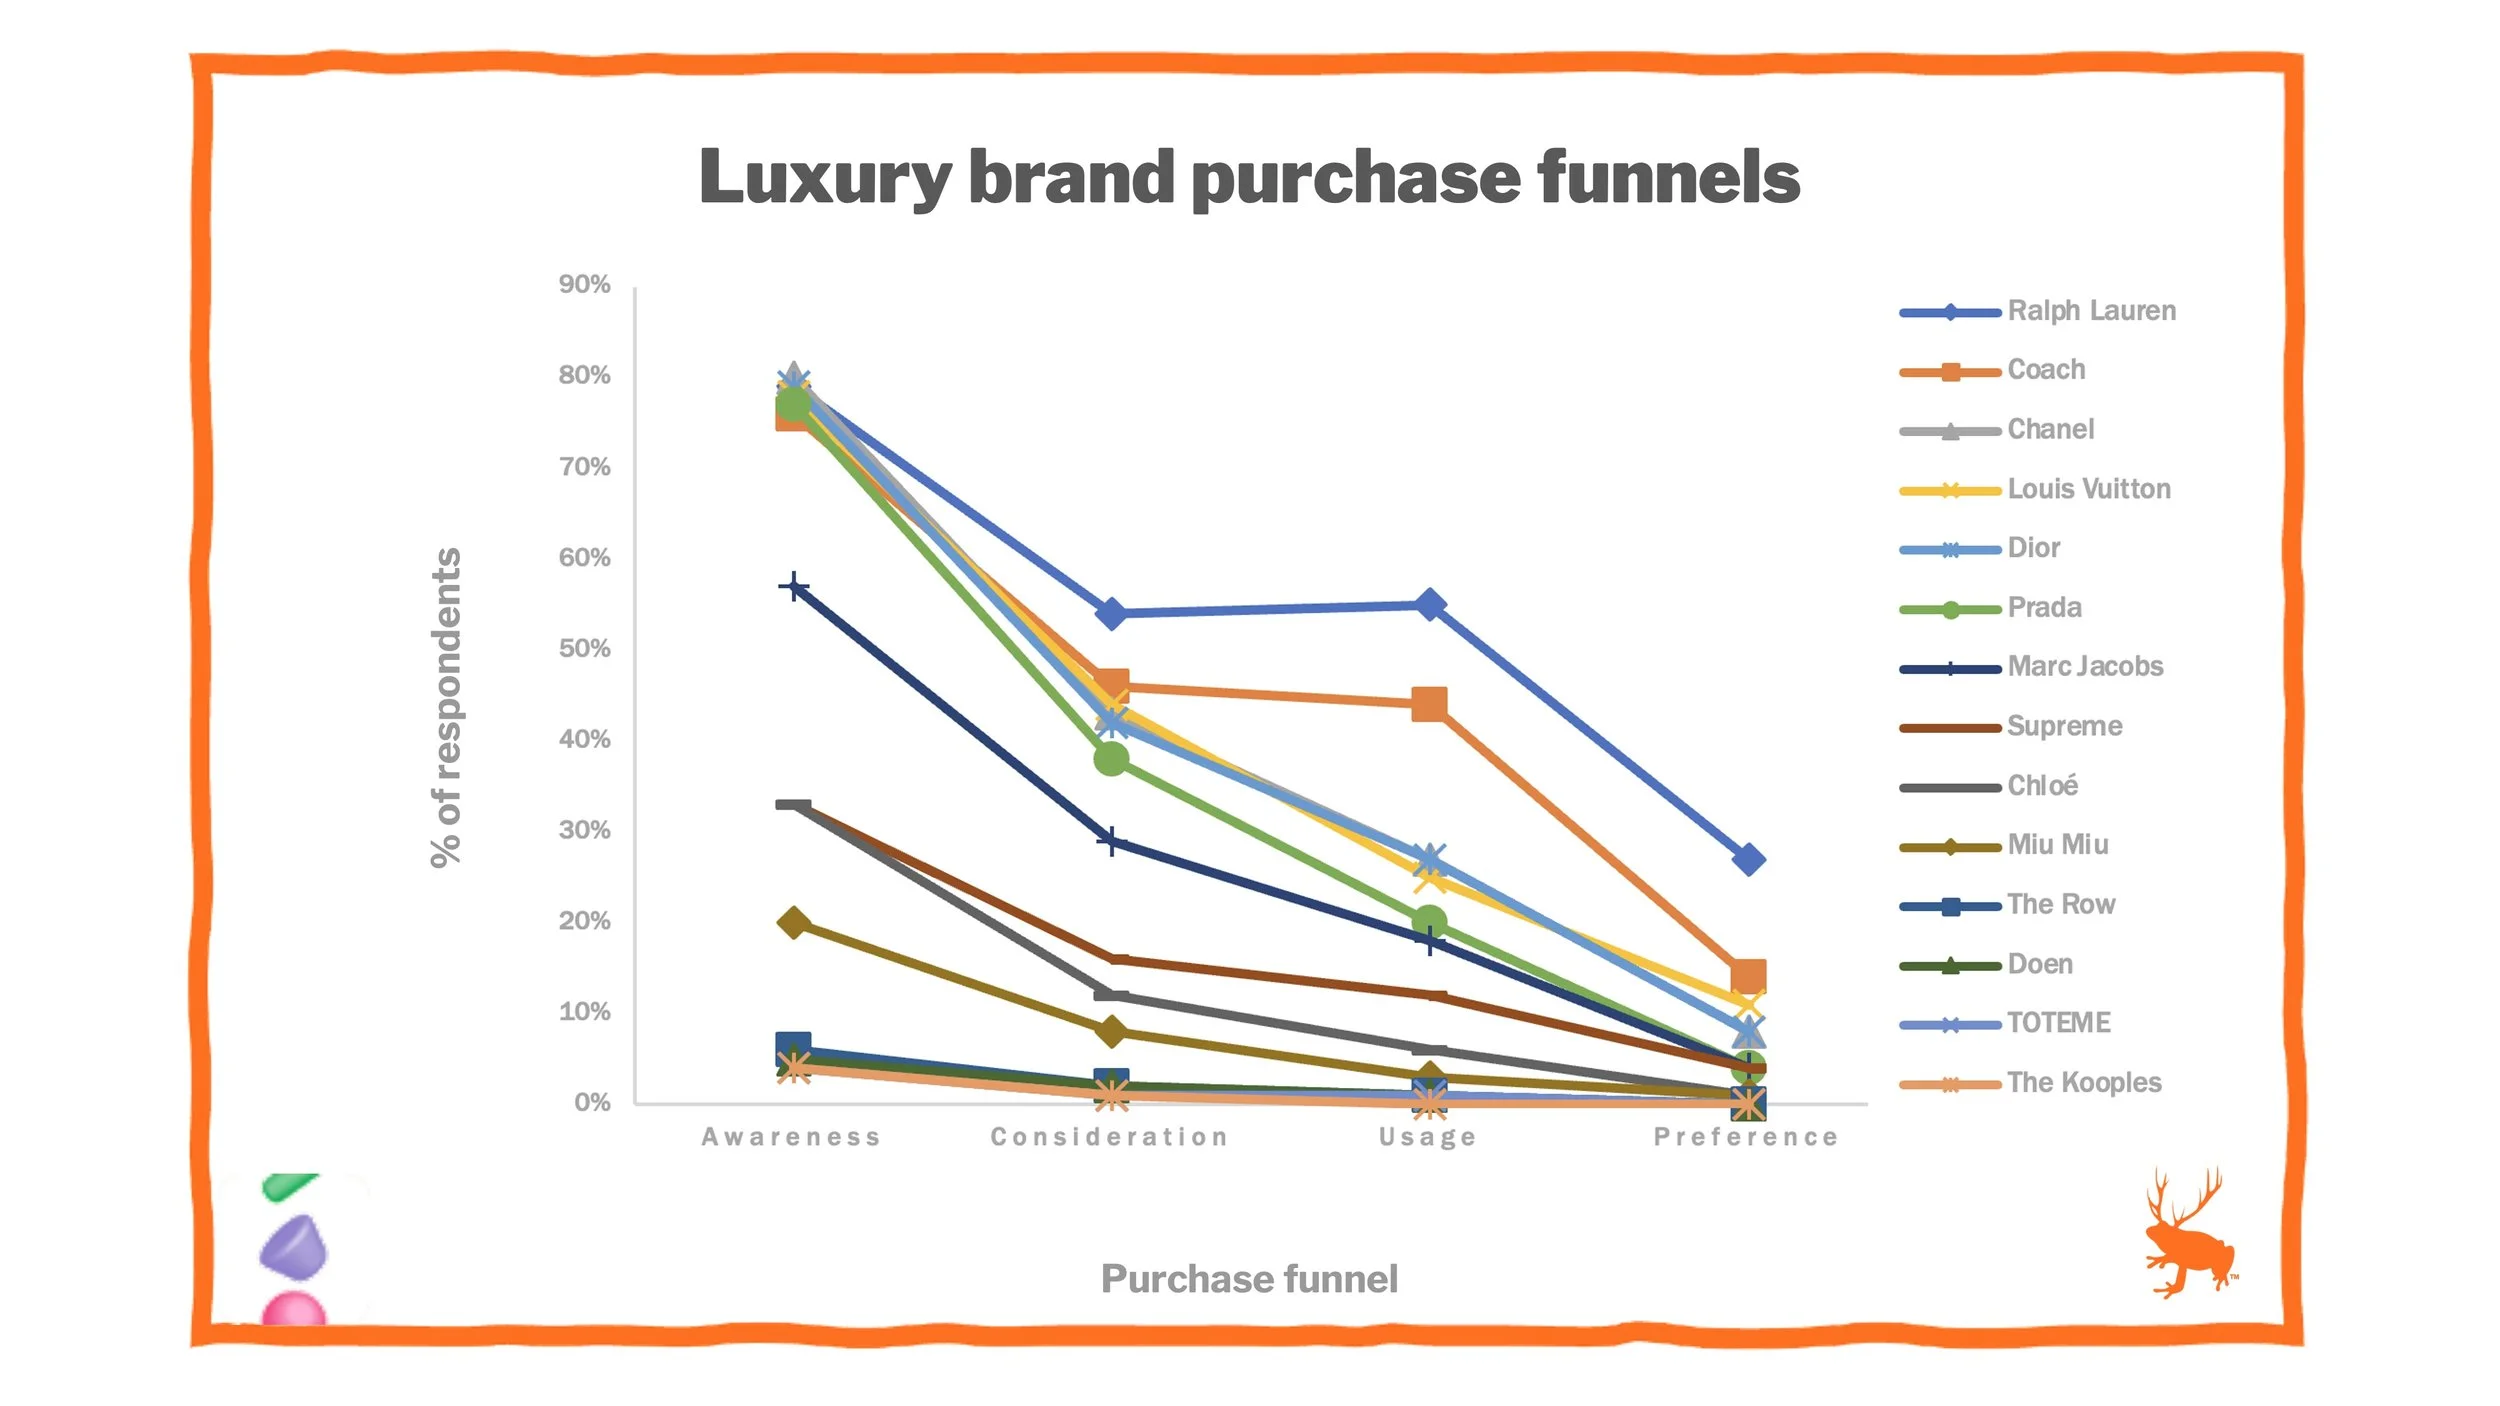
Do luxury brands play by different rules?
This week brought to you by Tracksuit: we ask: do luxury brands play by the same laws as shampoo and noodles, or are they bricks floating in space?
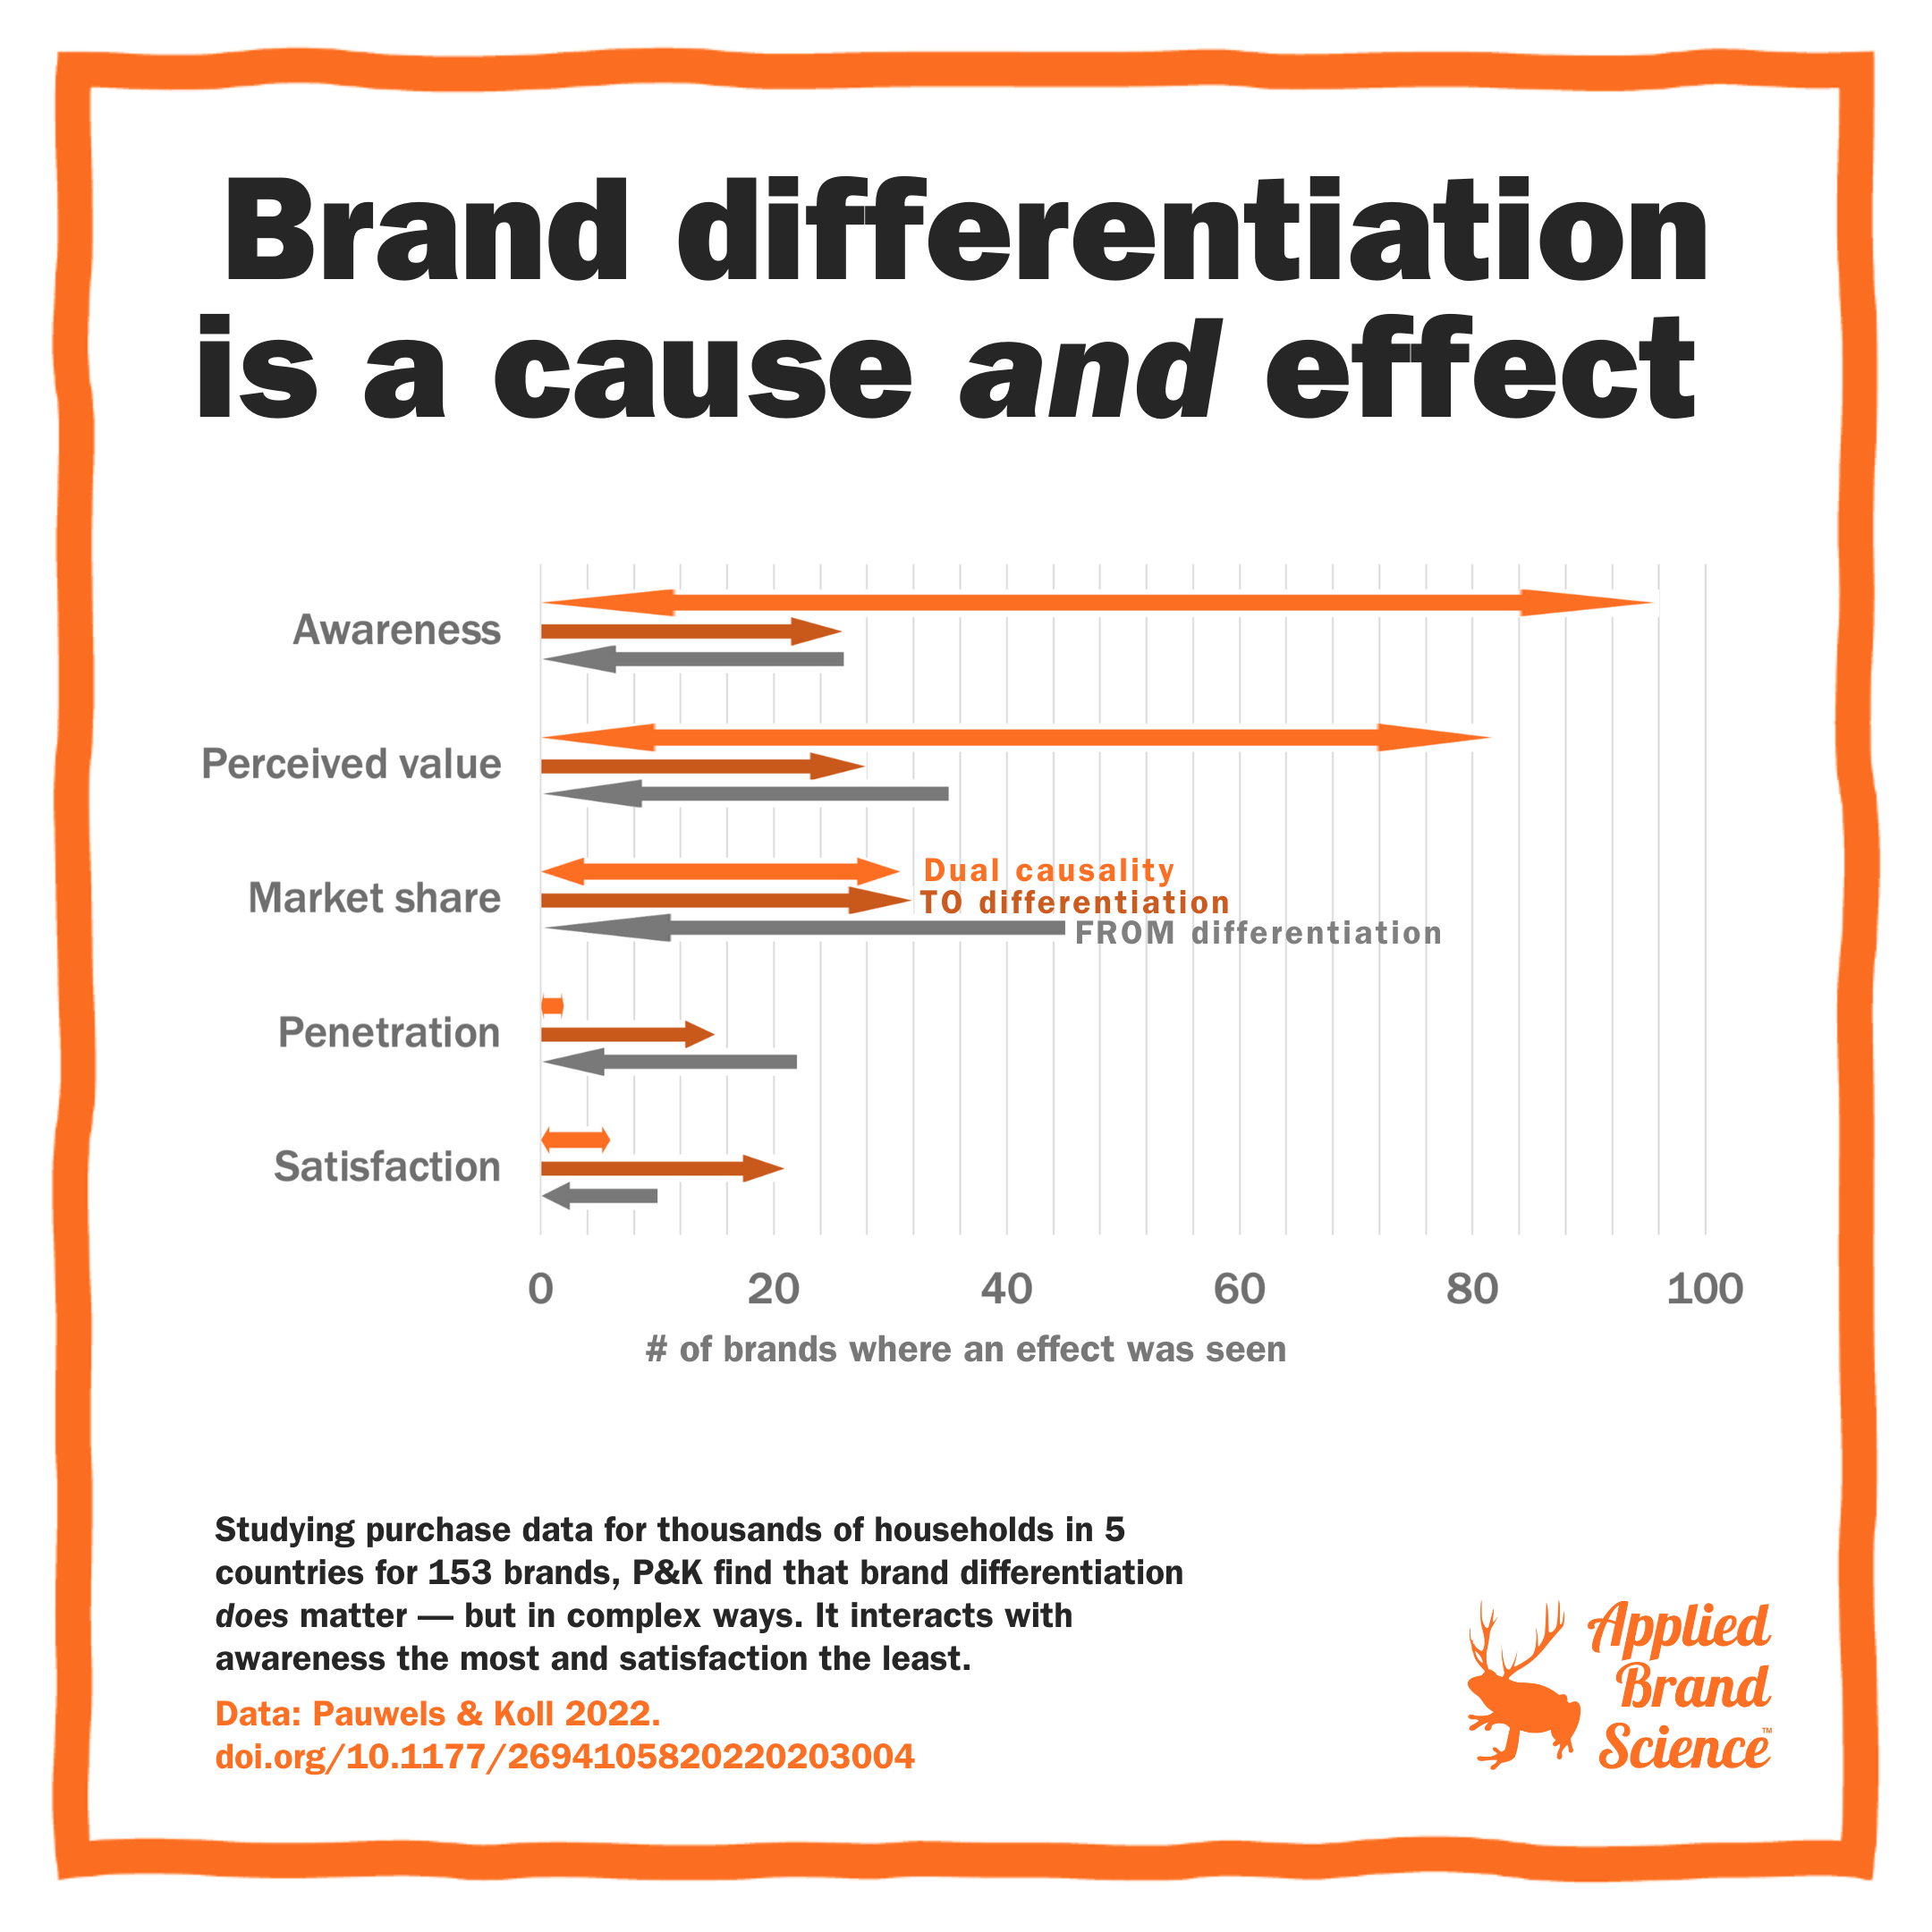
How does brand differentiation affect your business?
For decades we’ve preached differentiation—yet the Ehrenberg-Bass Institute says most brands are basically interchangeable.
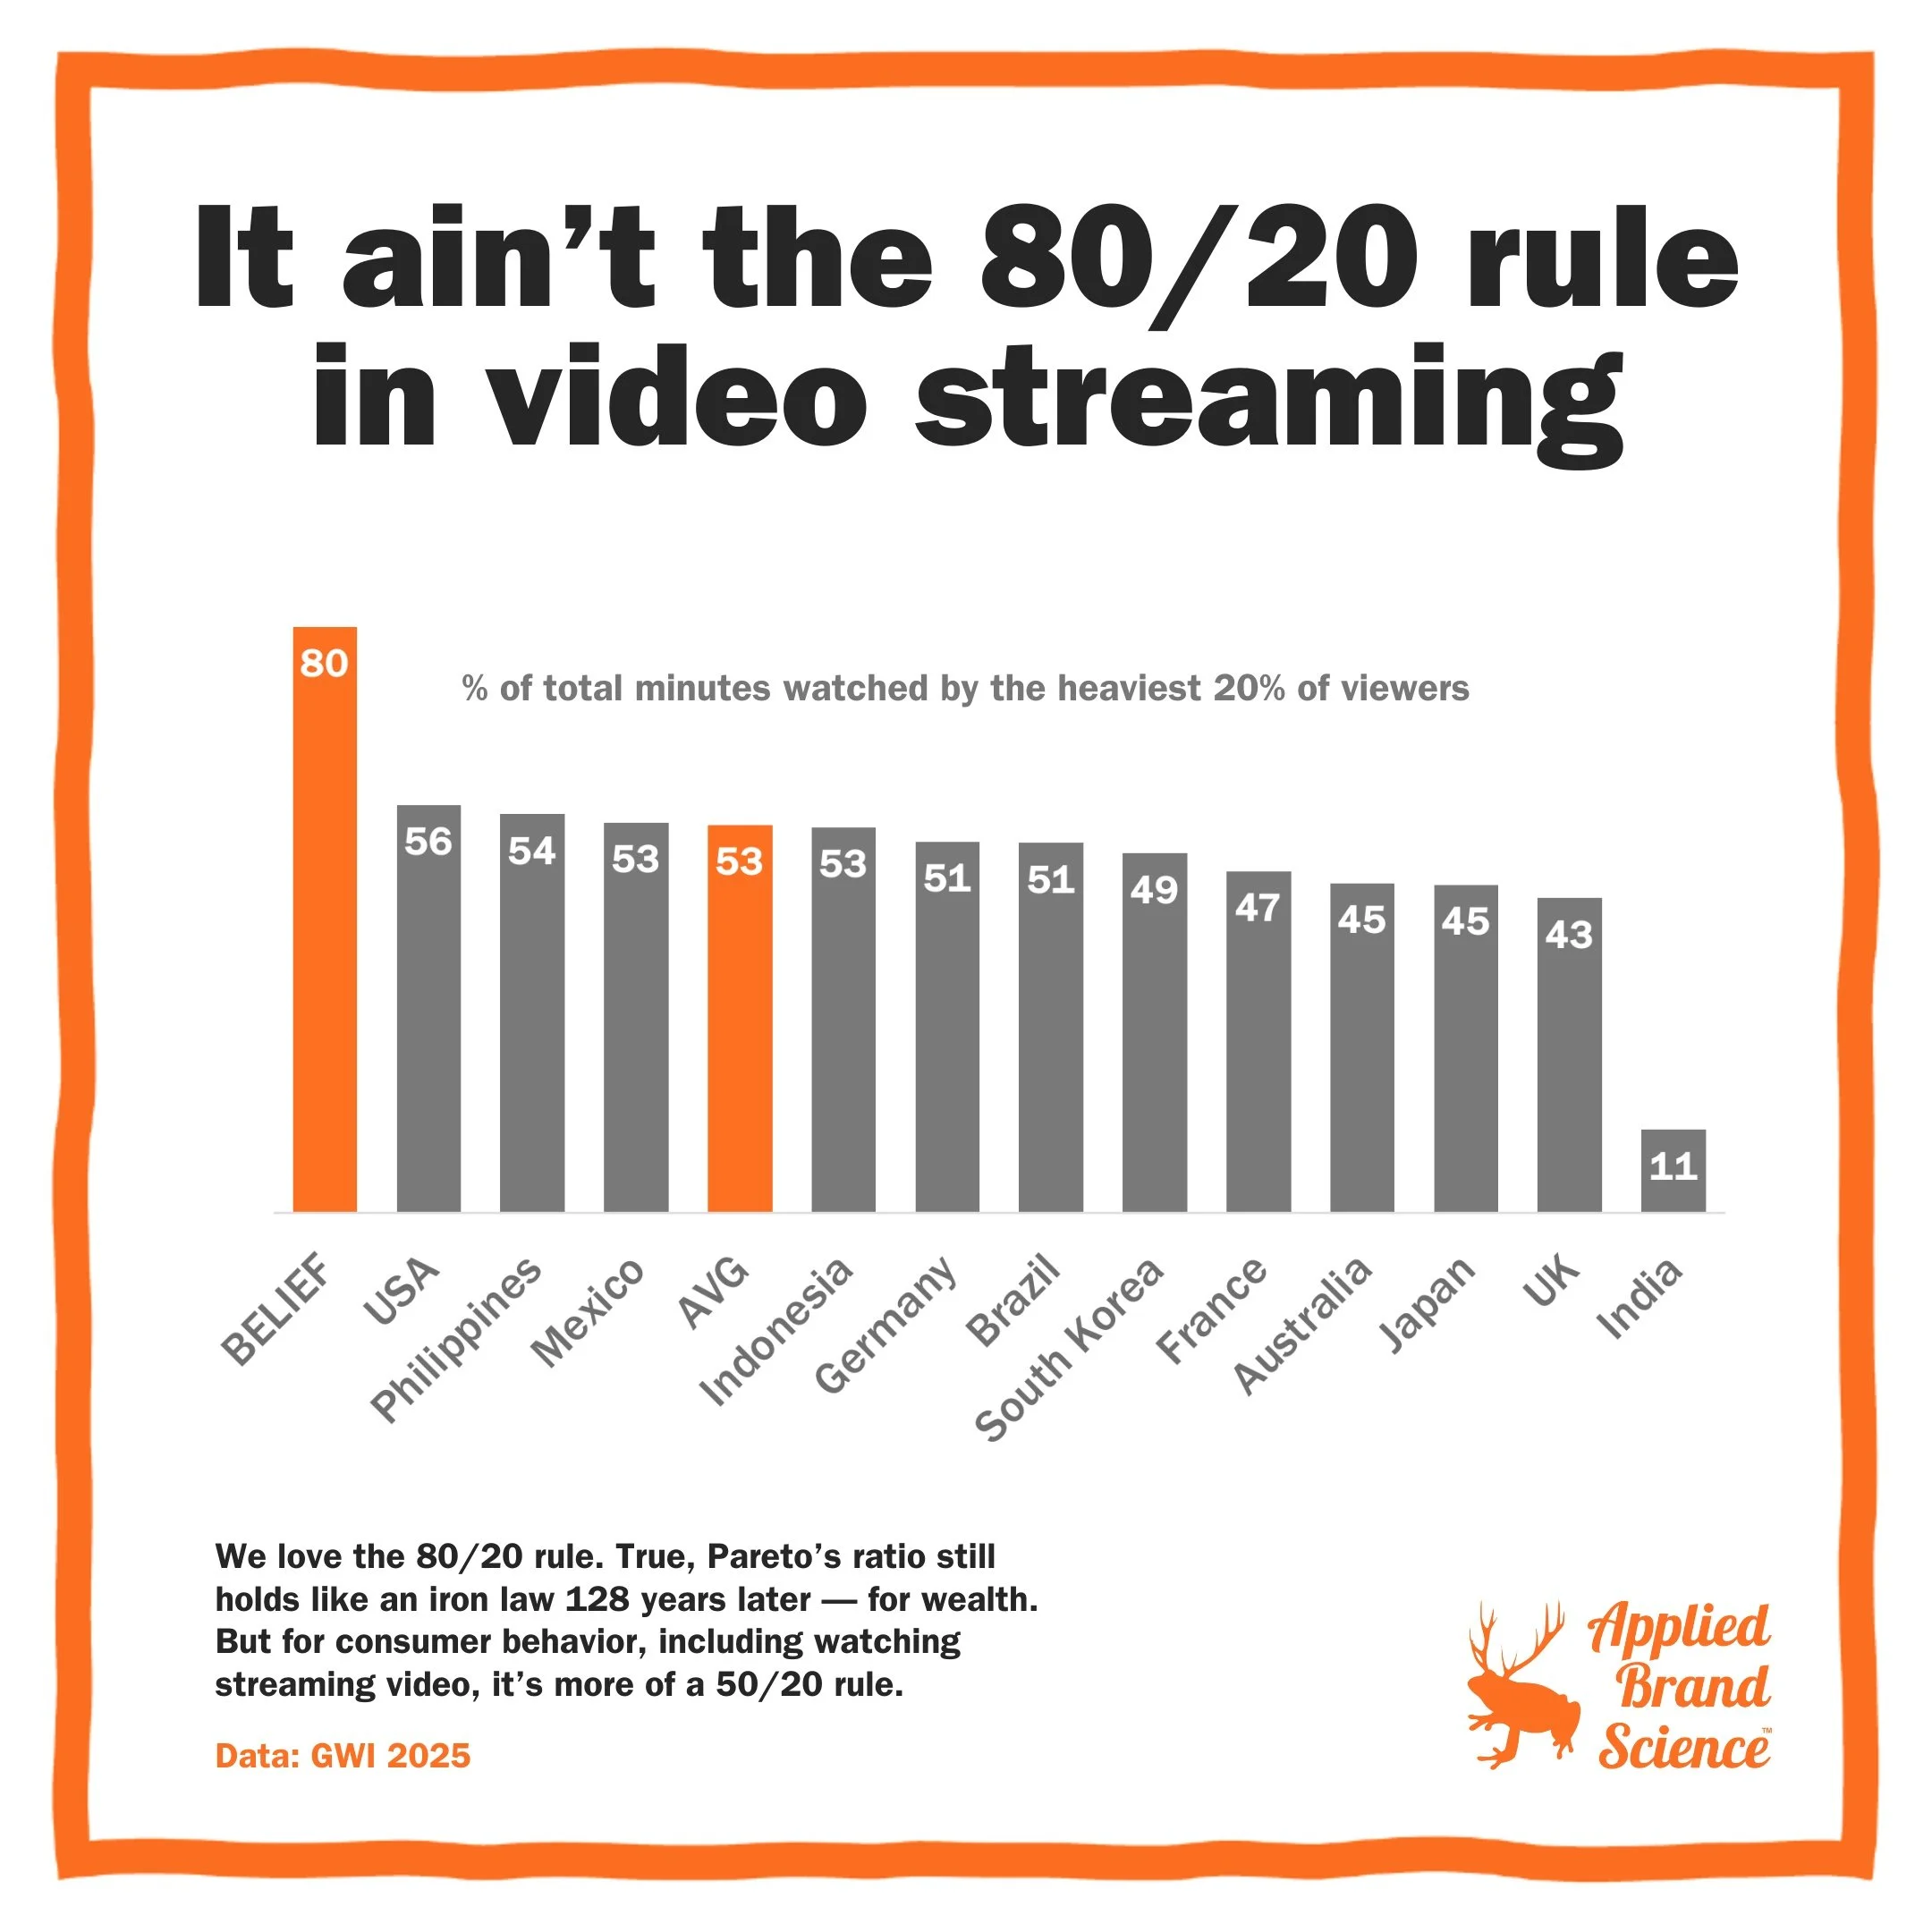
Do streaming services follow the 80/20 rule?
Does 20% of the audience really account for 80% of the viewing—Pareto-style, not Janet Jackson-style?
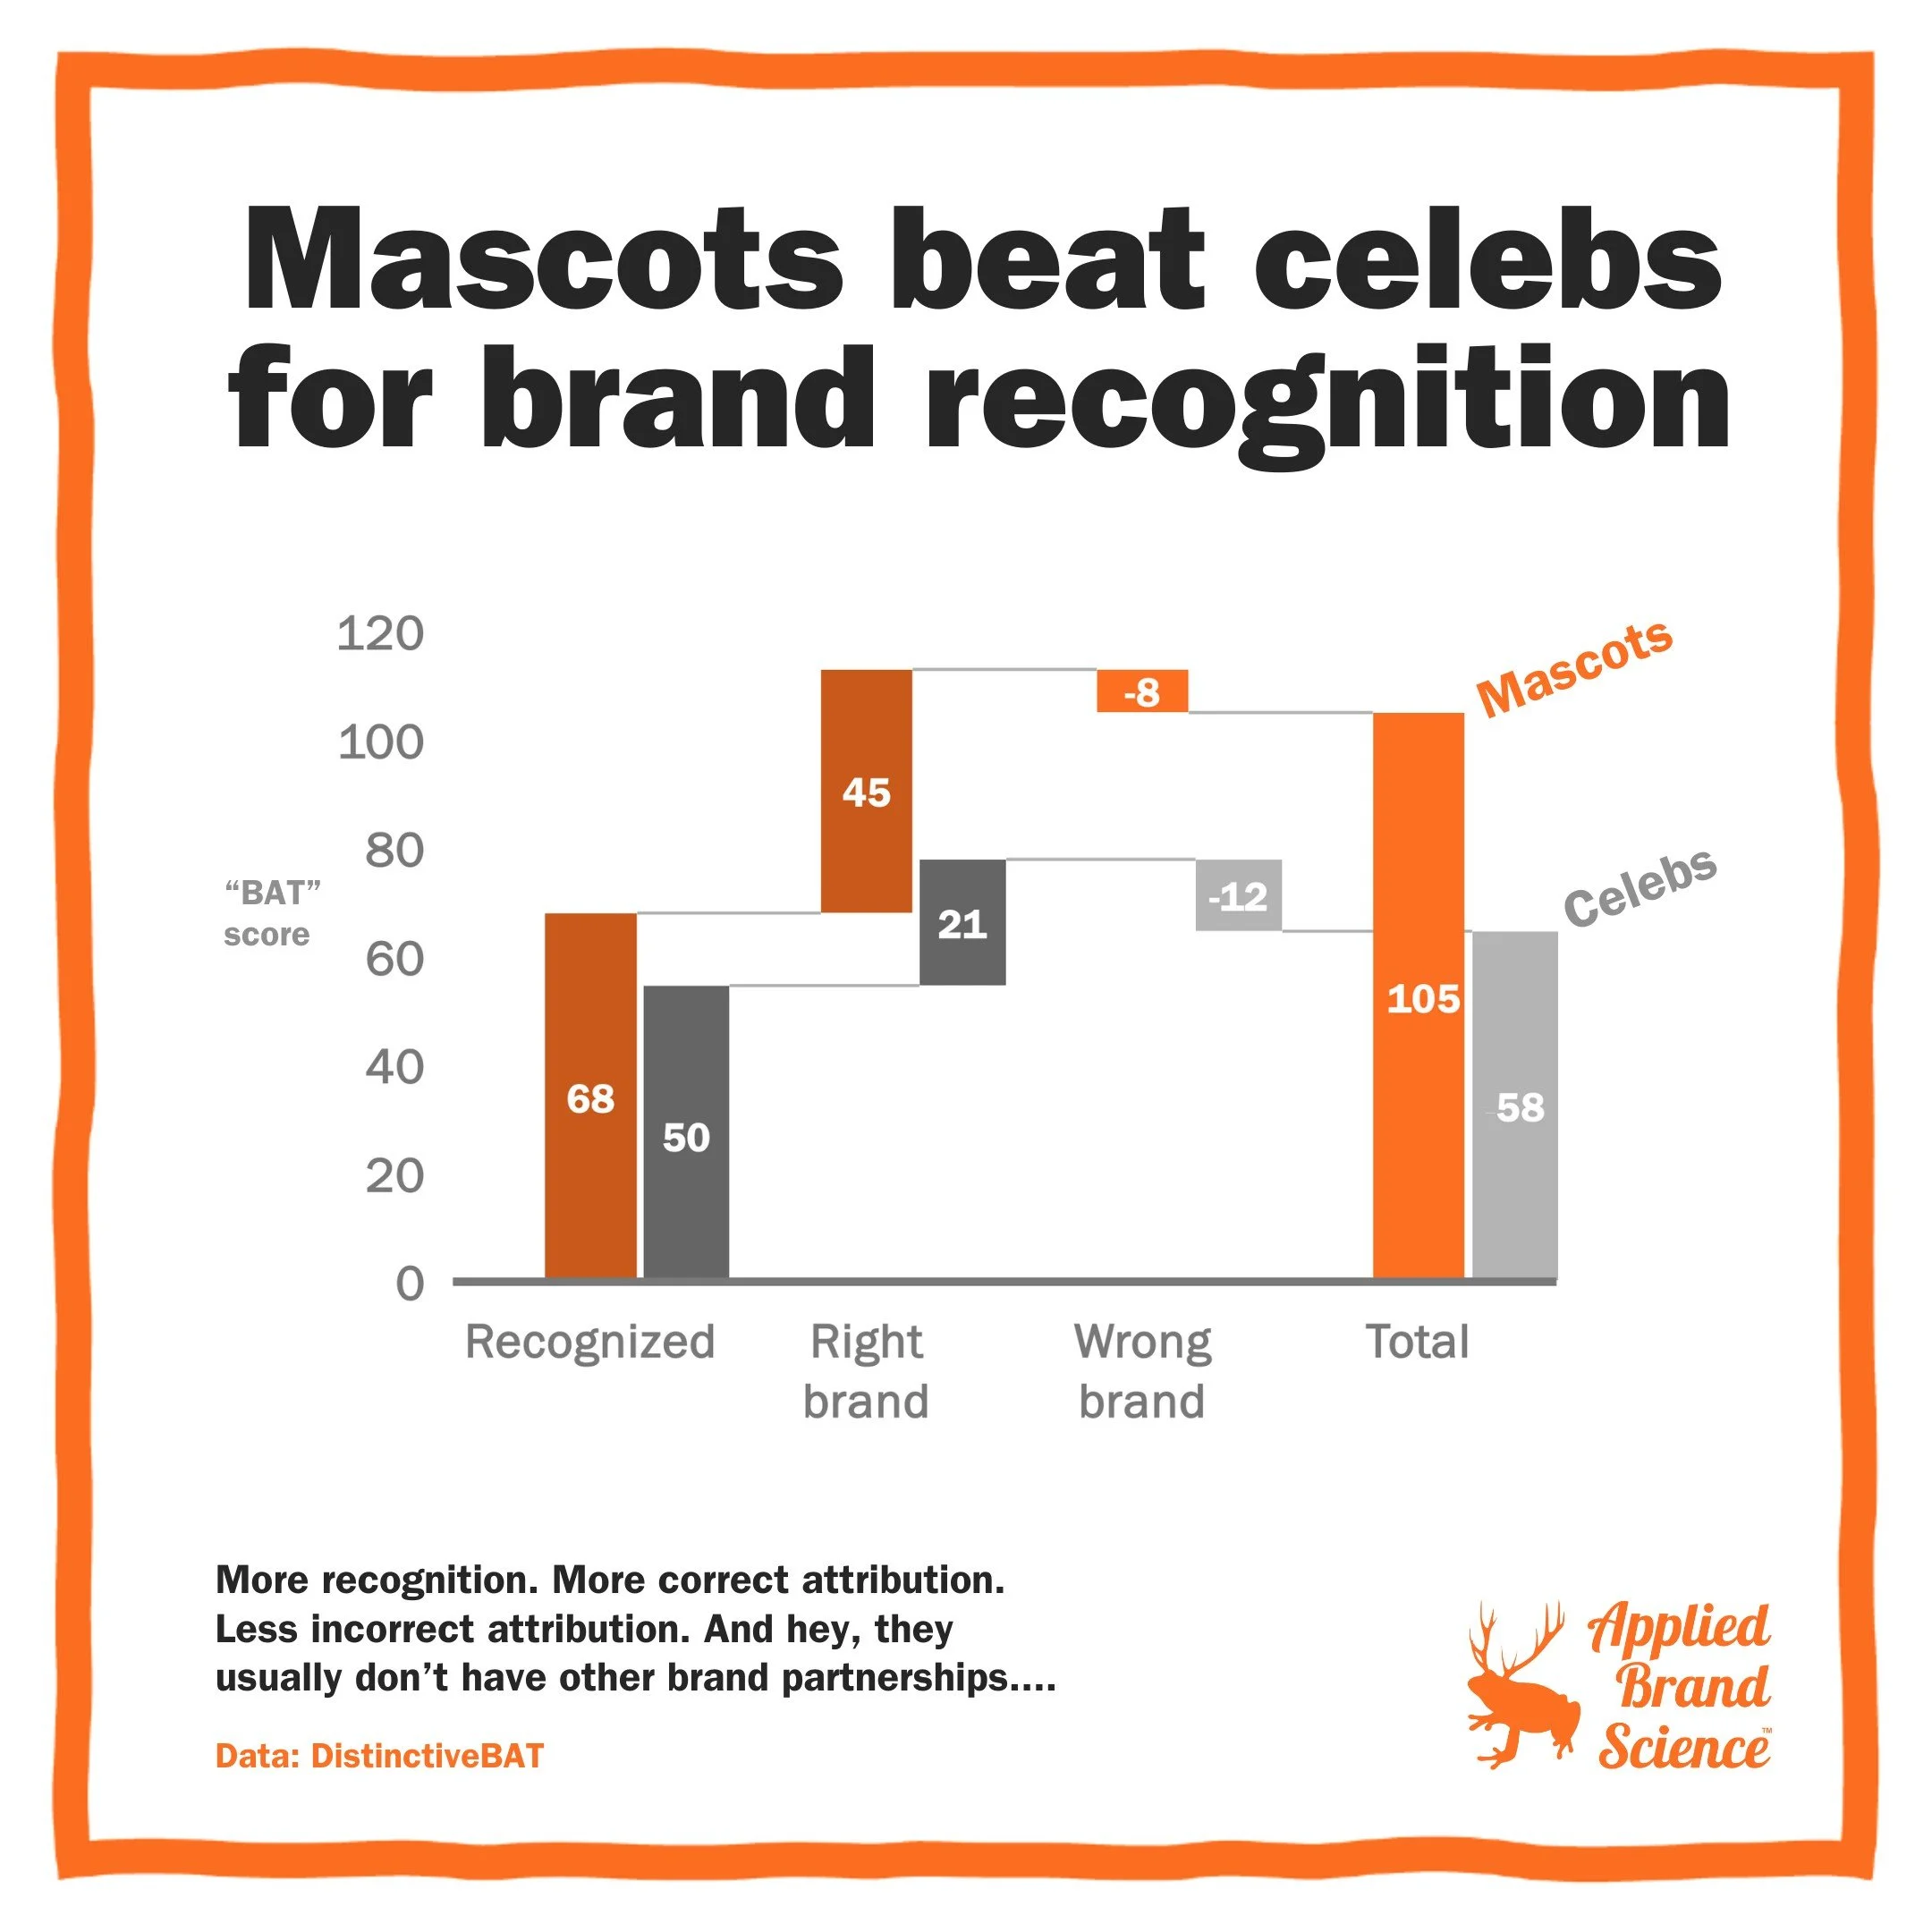
What’s better, celebs or mascots?
If your brand needs a face, who wins—celebs, mascots, or talking carrots? DistinctiveBAT crunched the numbers.
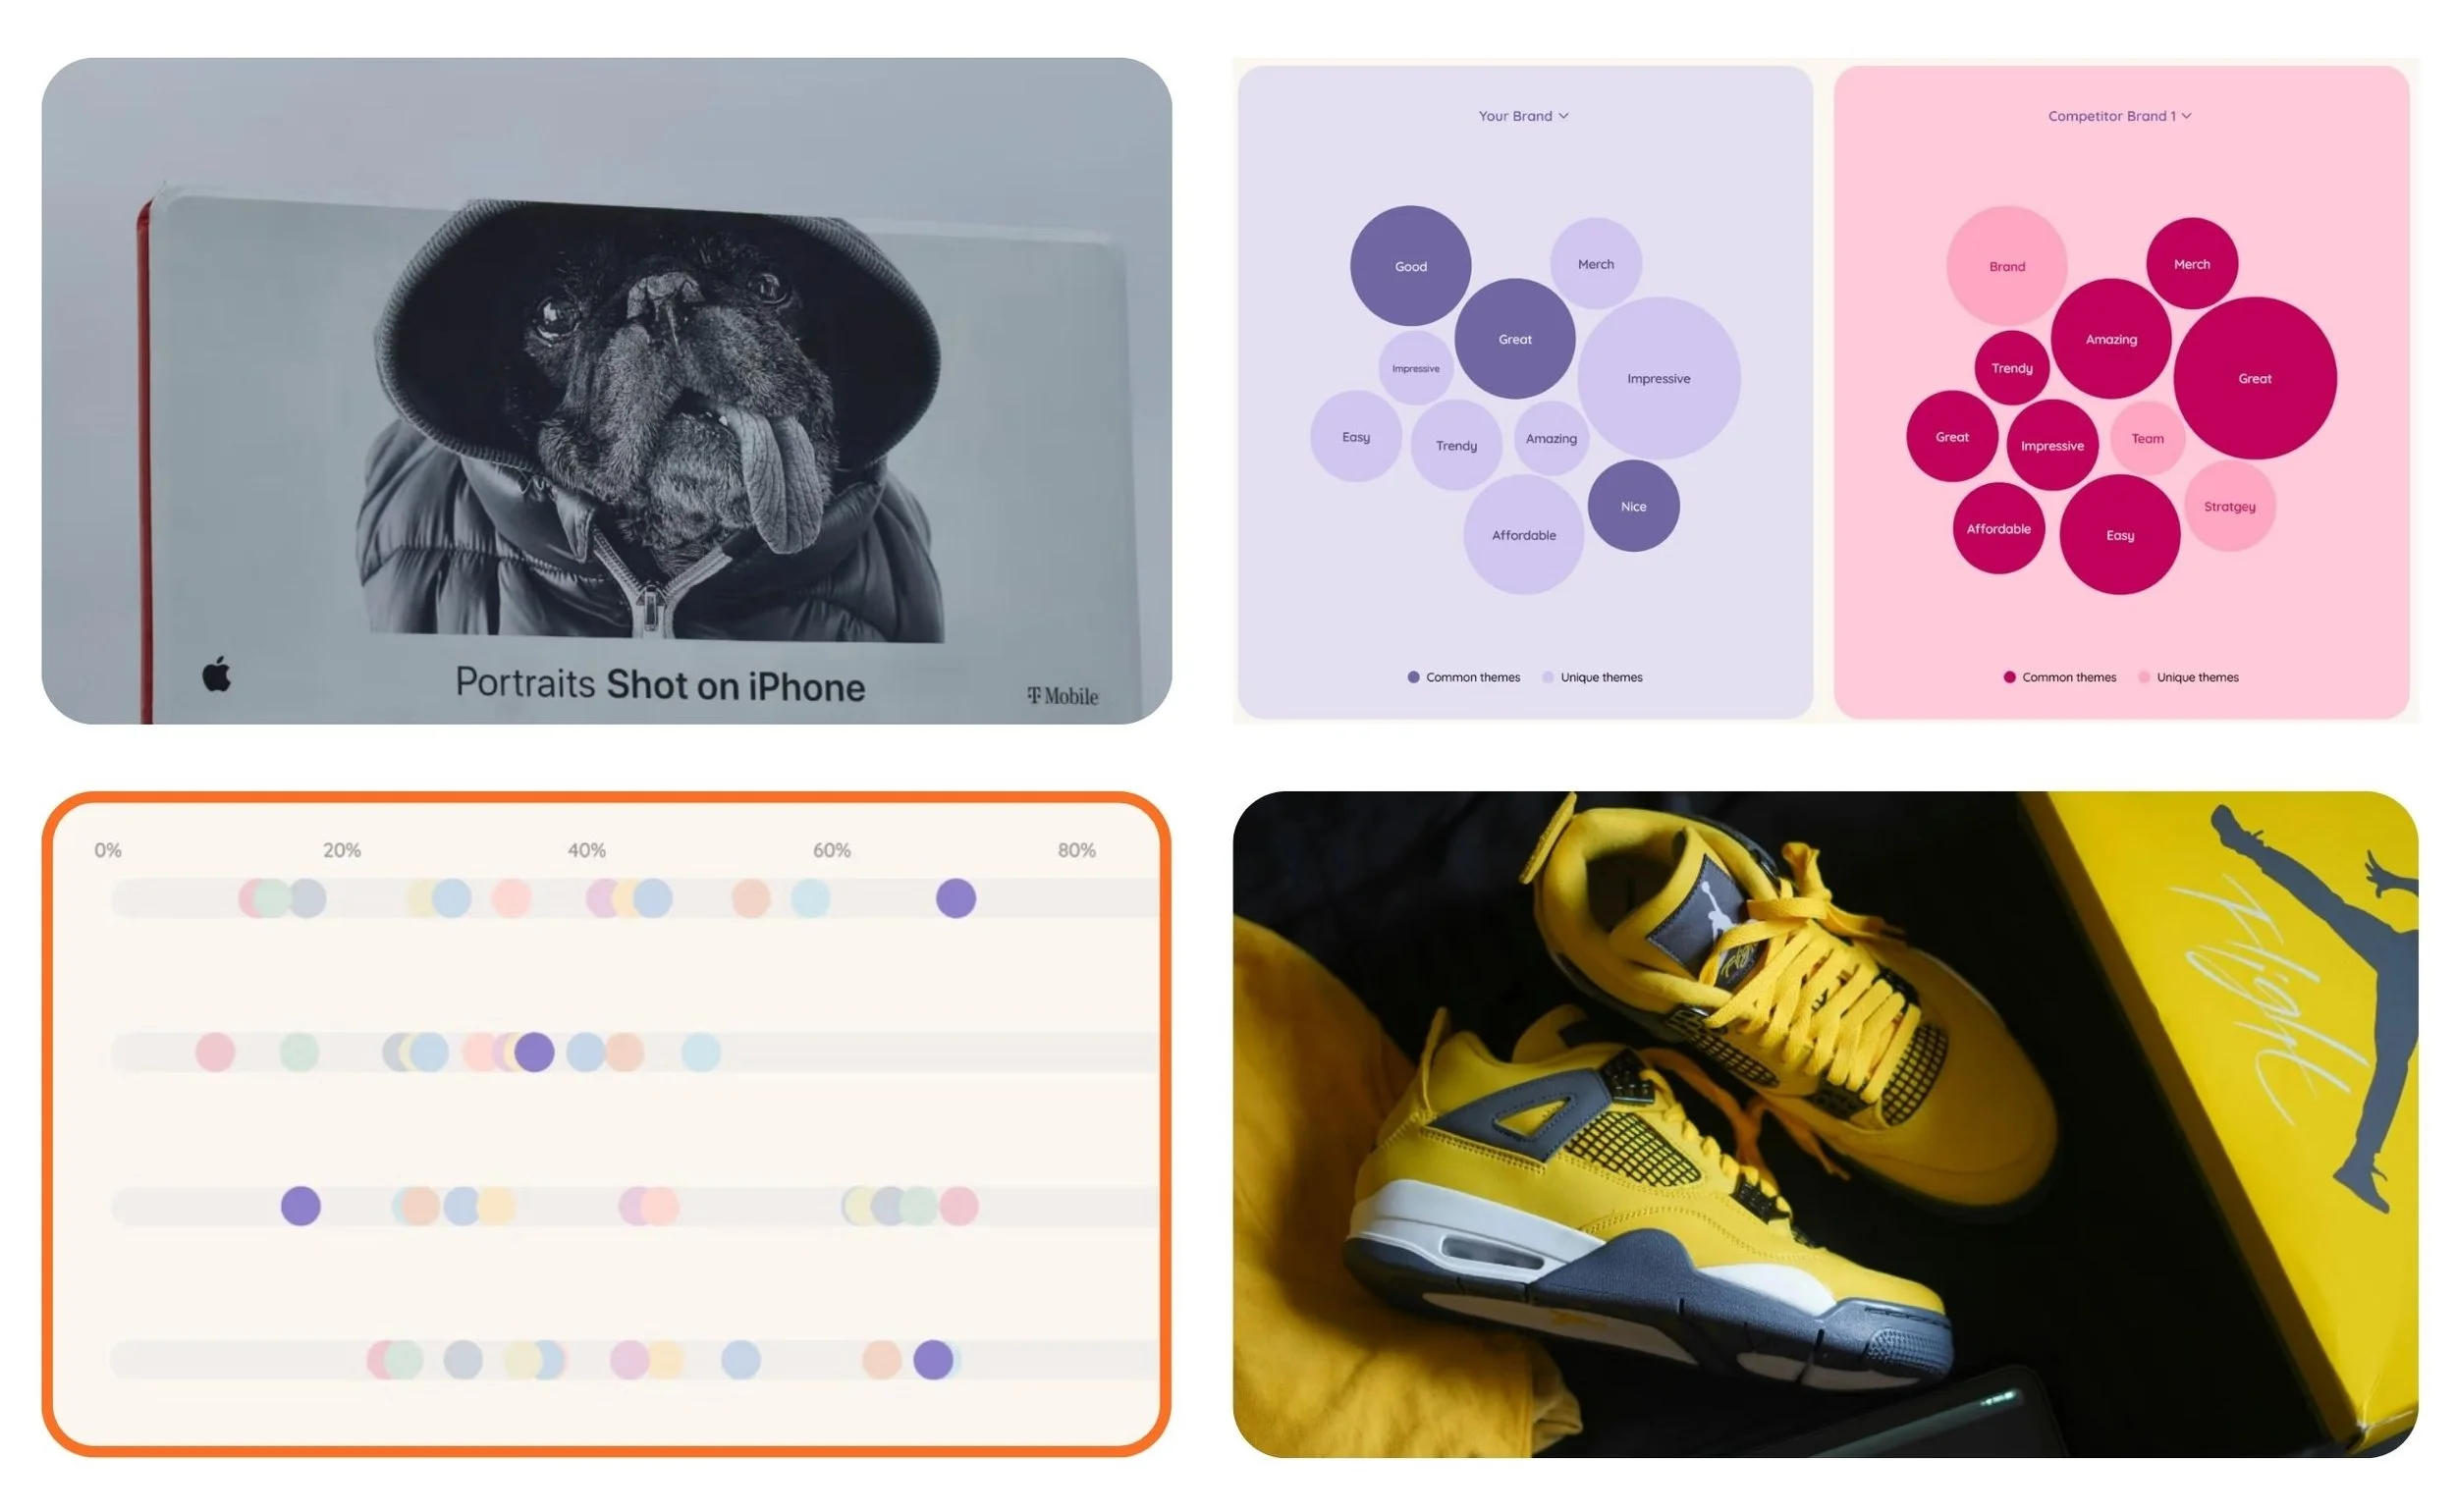
How do you know if your brand is “on brand”?
This week, we have a new twist. This is the beginning of an article I wrote in partnership with Tracksuit, the brand tracking company.
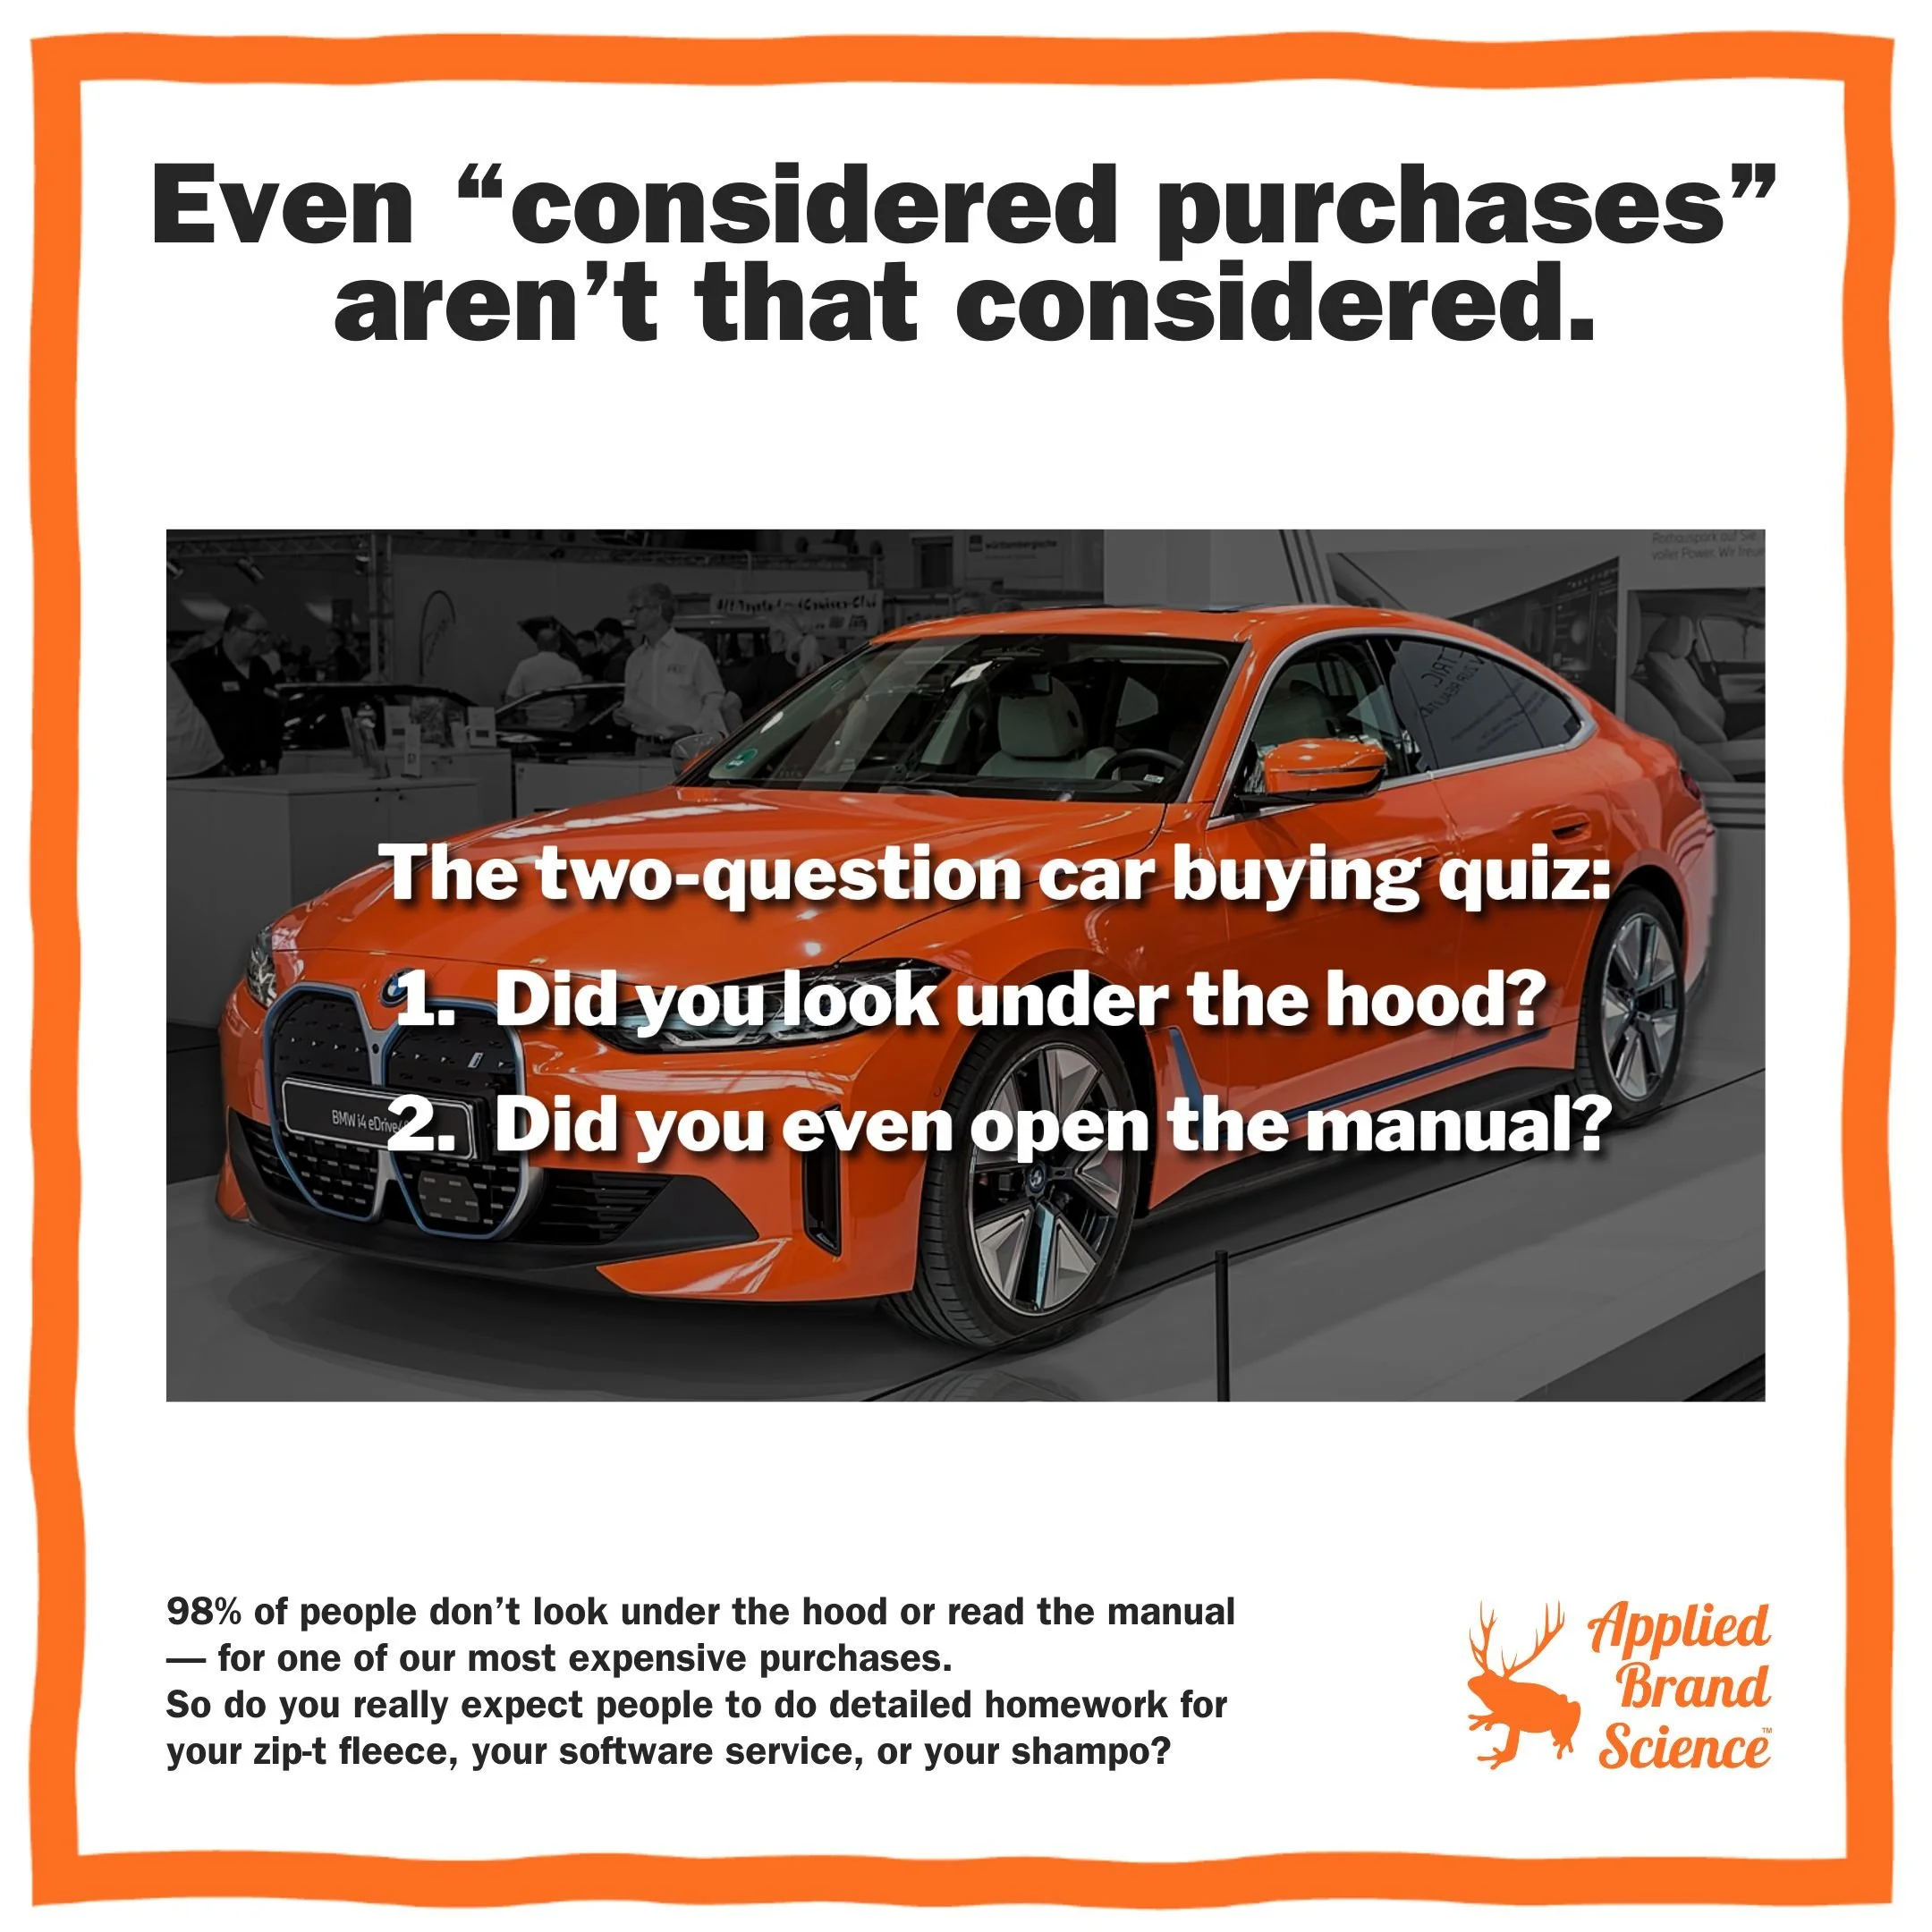
How “considered” are considered purchases, really?
Do people really research big-ticket buys more? Kinda—but not nearly as much as you’d think.
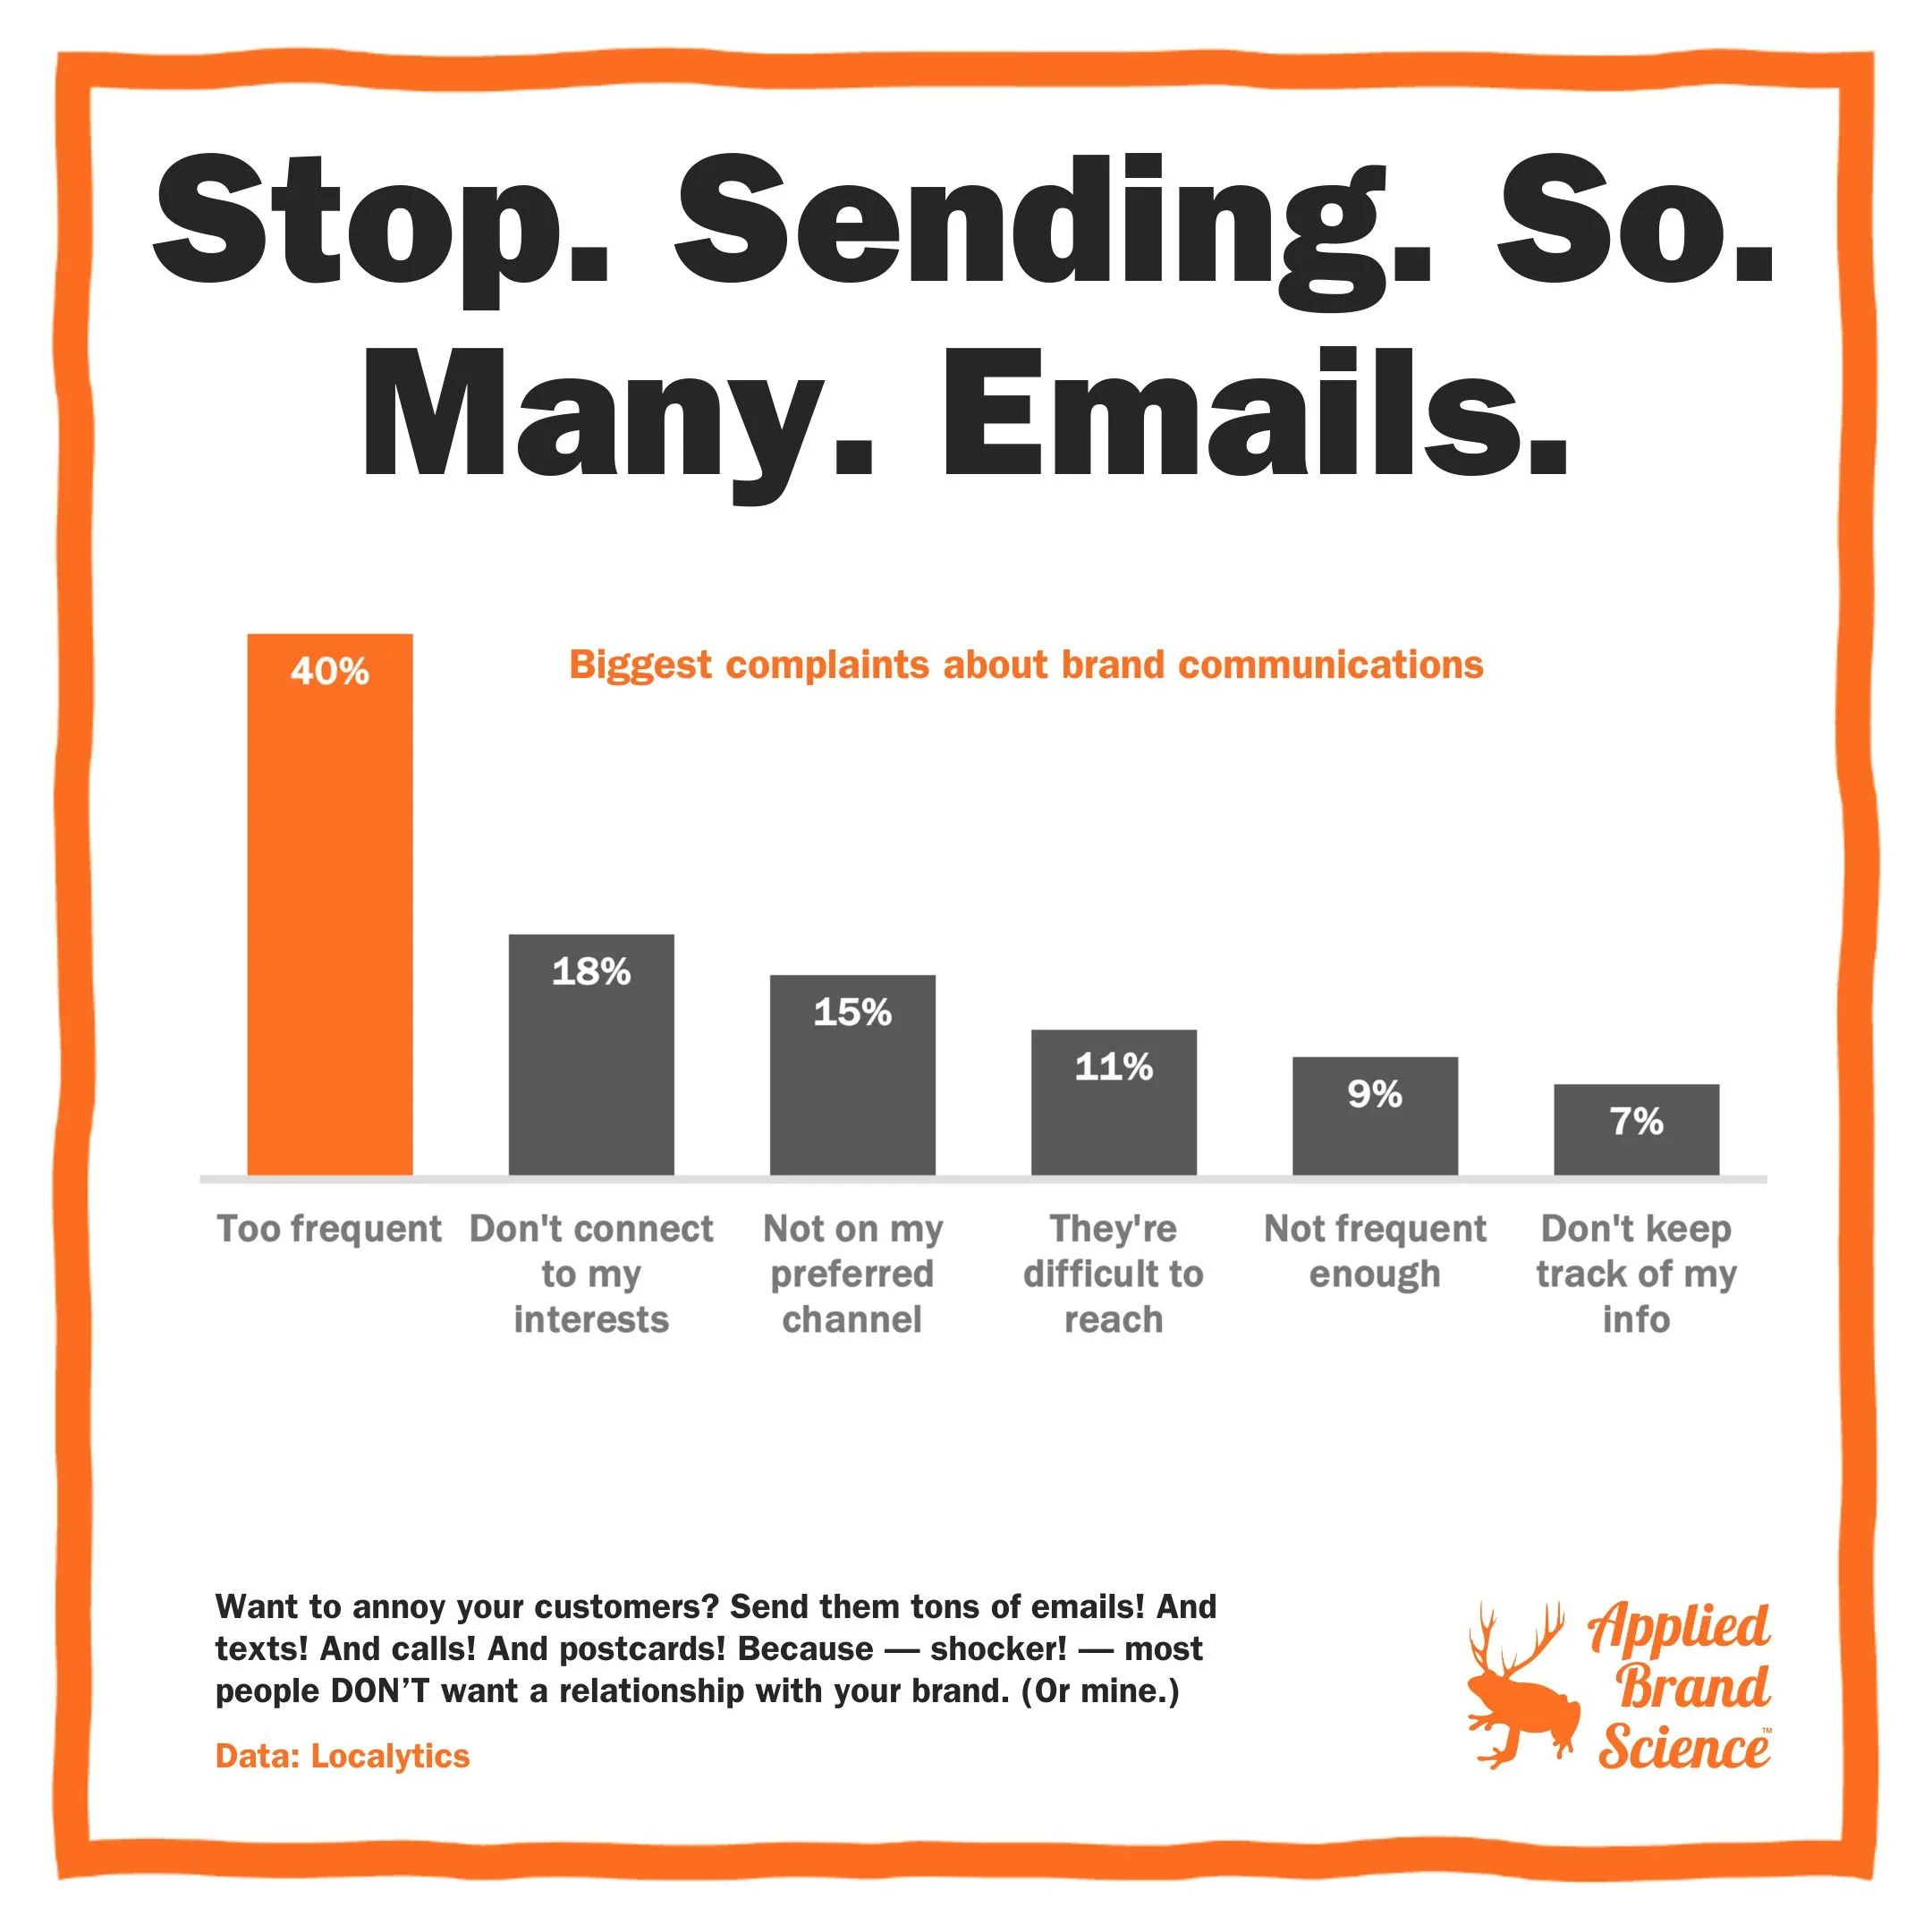
Are you sending enough emails to customers?
Localytics asked 1,000 people about brand communication, and the top complaint—by far—was simple: too much, too often.
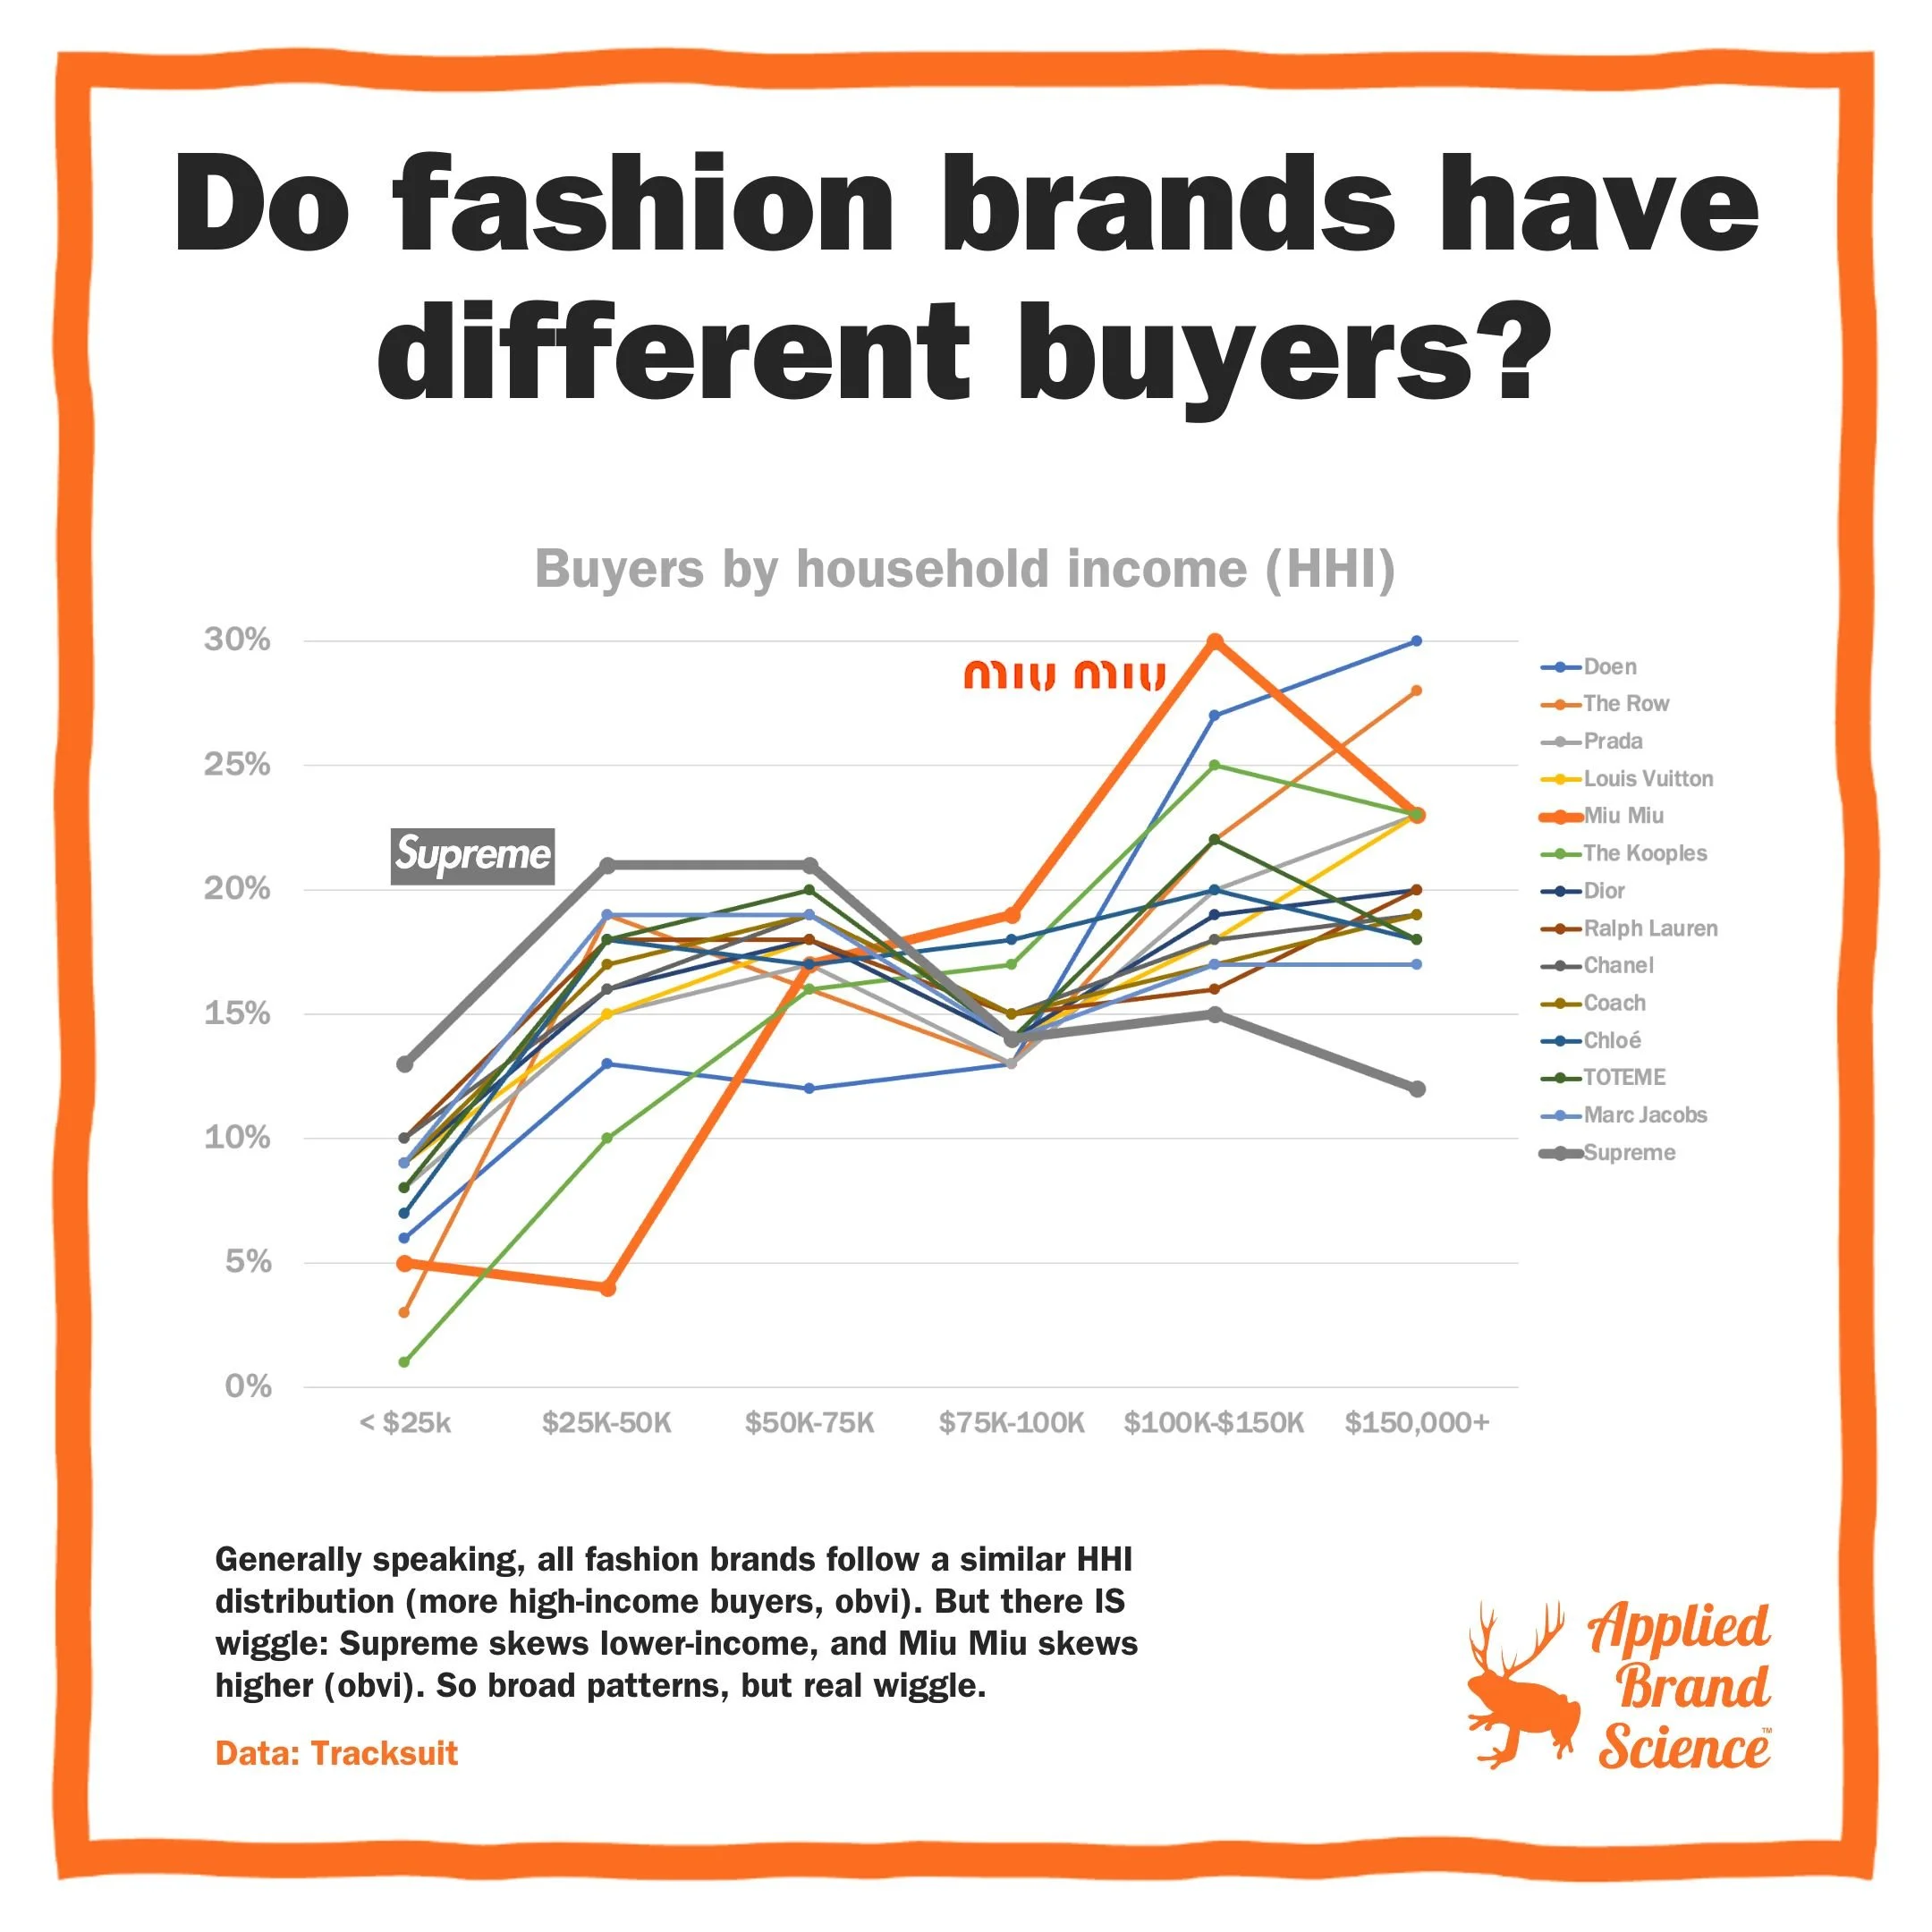
Do luxury Brands have different buyers?
Do brands really sell to different types of people—or do they mostly share the same buyers, making differentiation a myth?
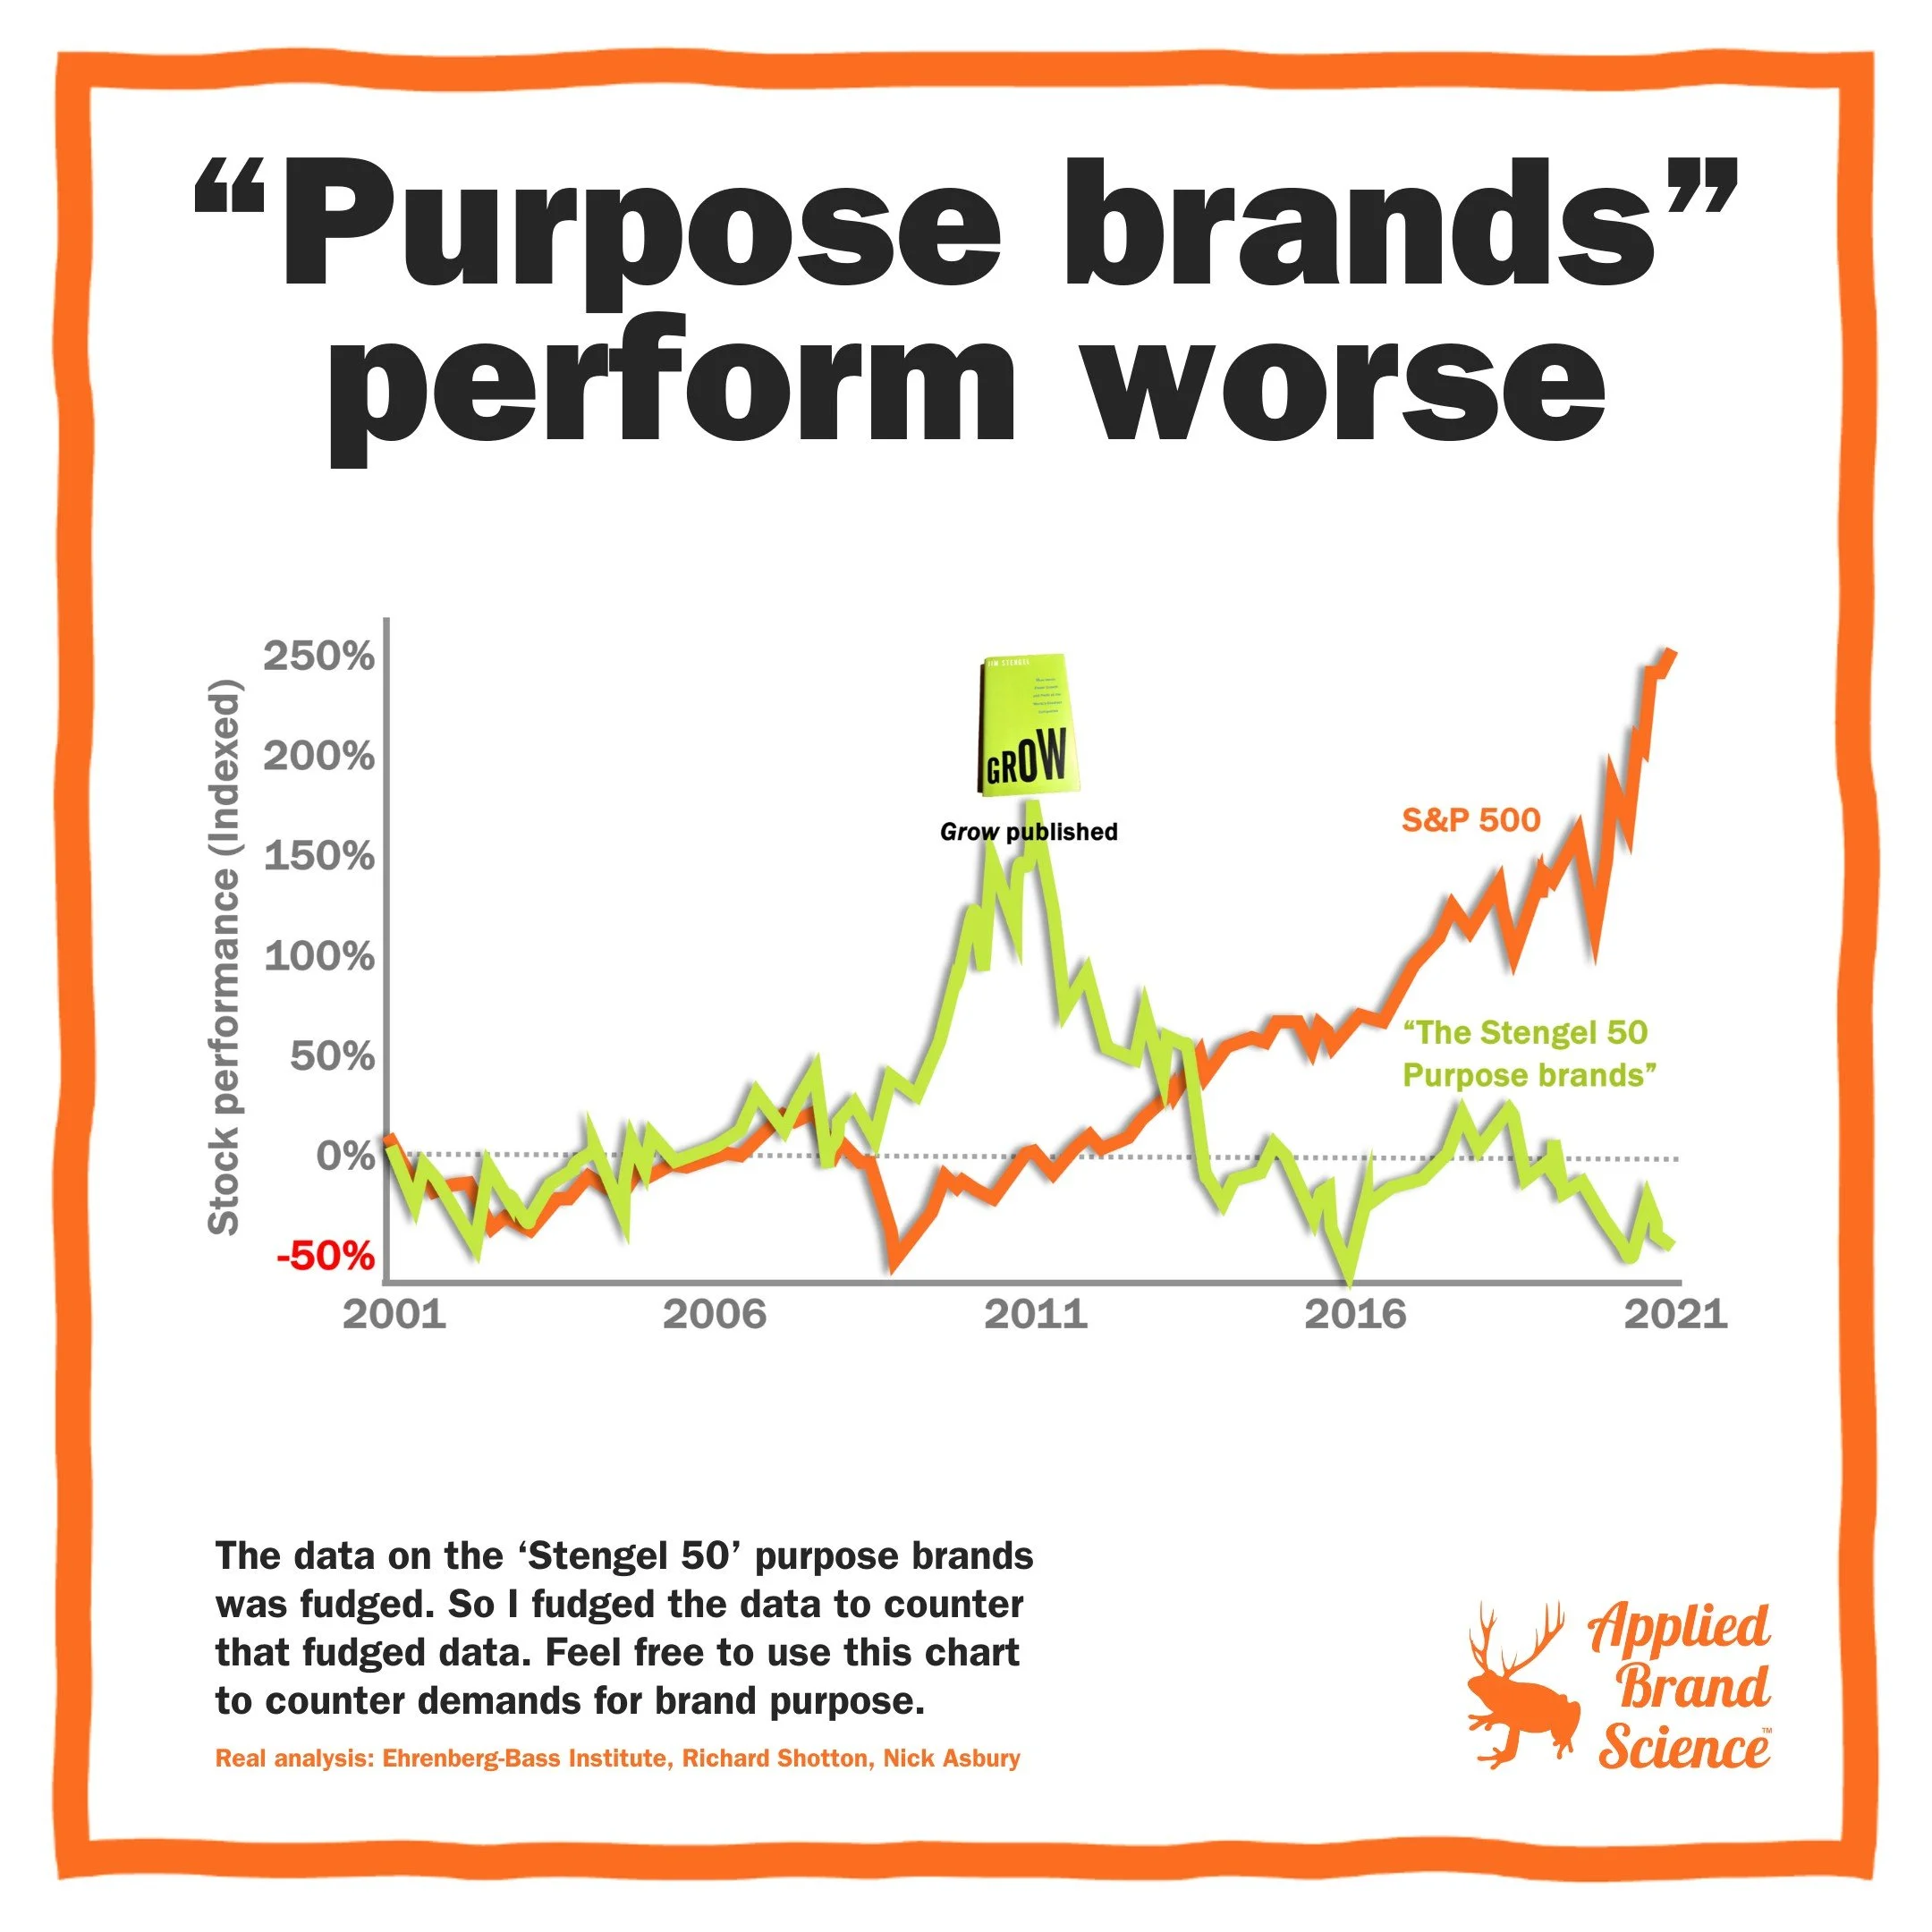
Do “purpose-driven brands” really perform better?
Does having a higher purpose actually boost financial performance—or is it just a beautiful idea we’ve all bought into?
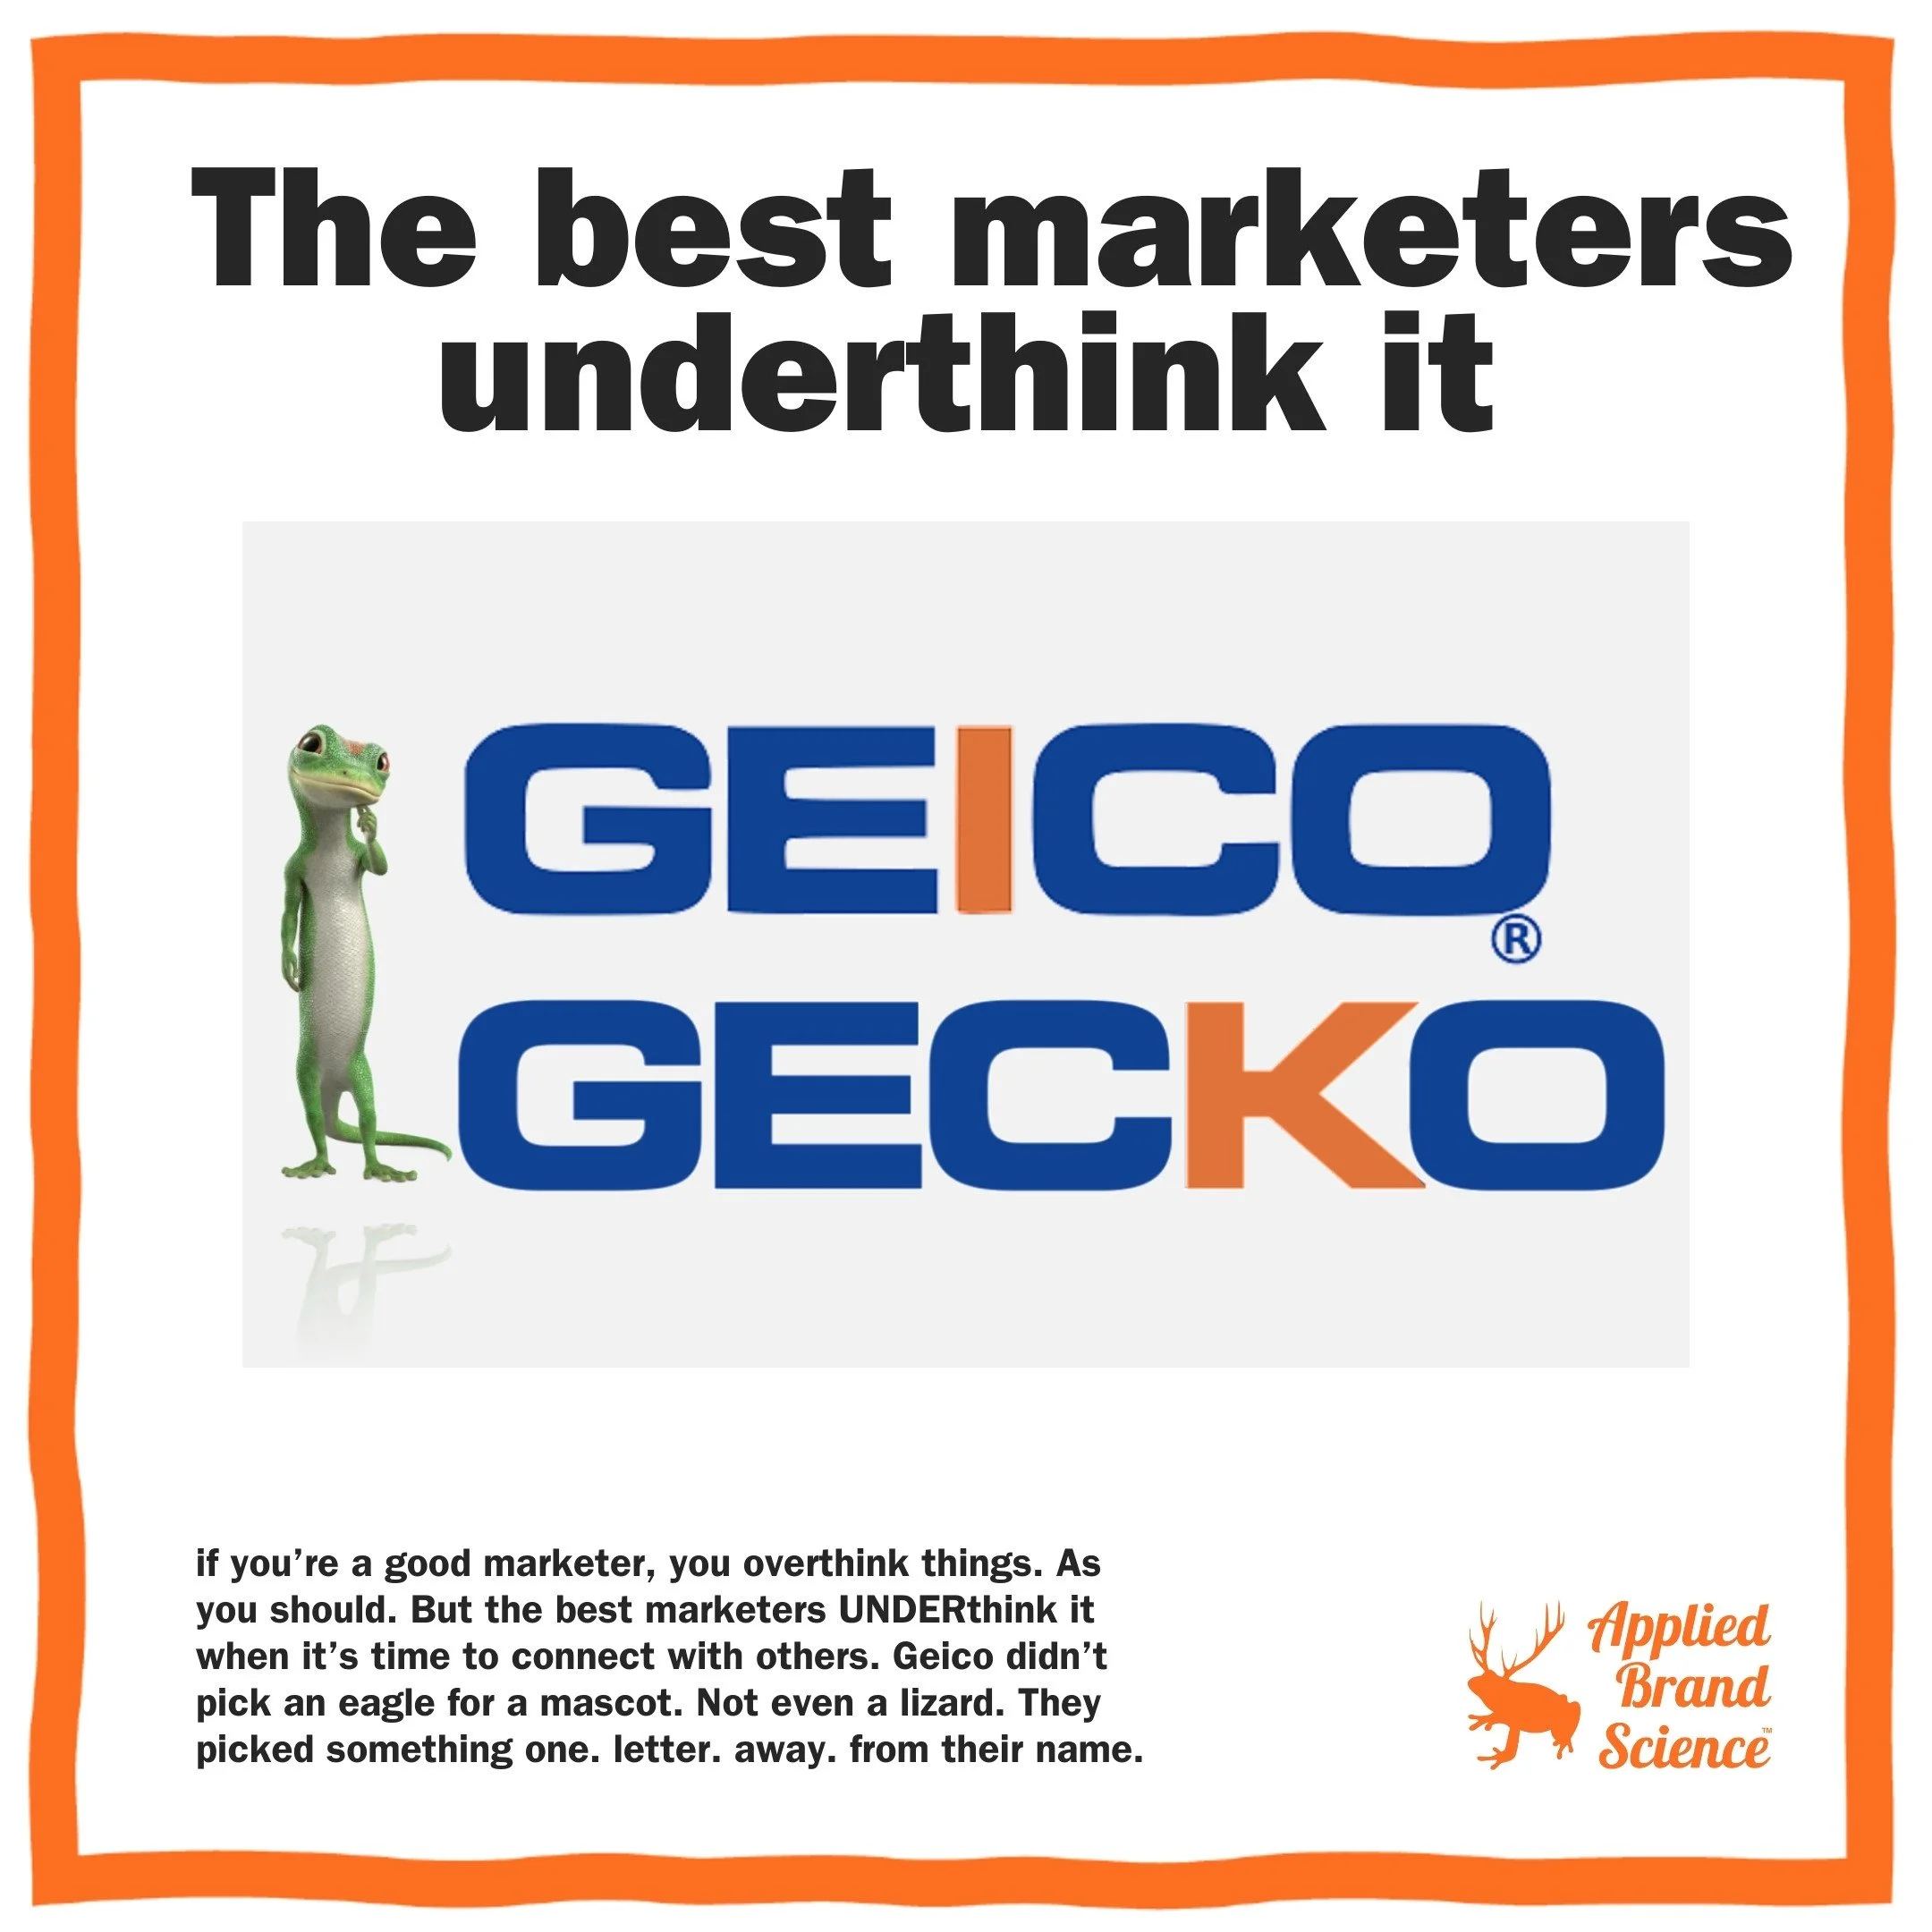
Are you UNDERthinking your brand enough?
Good marketers overthink strategy—but great marketers underthink how to actually connect with buyers.
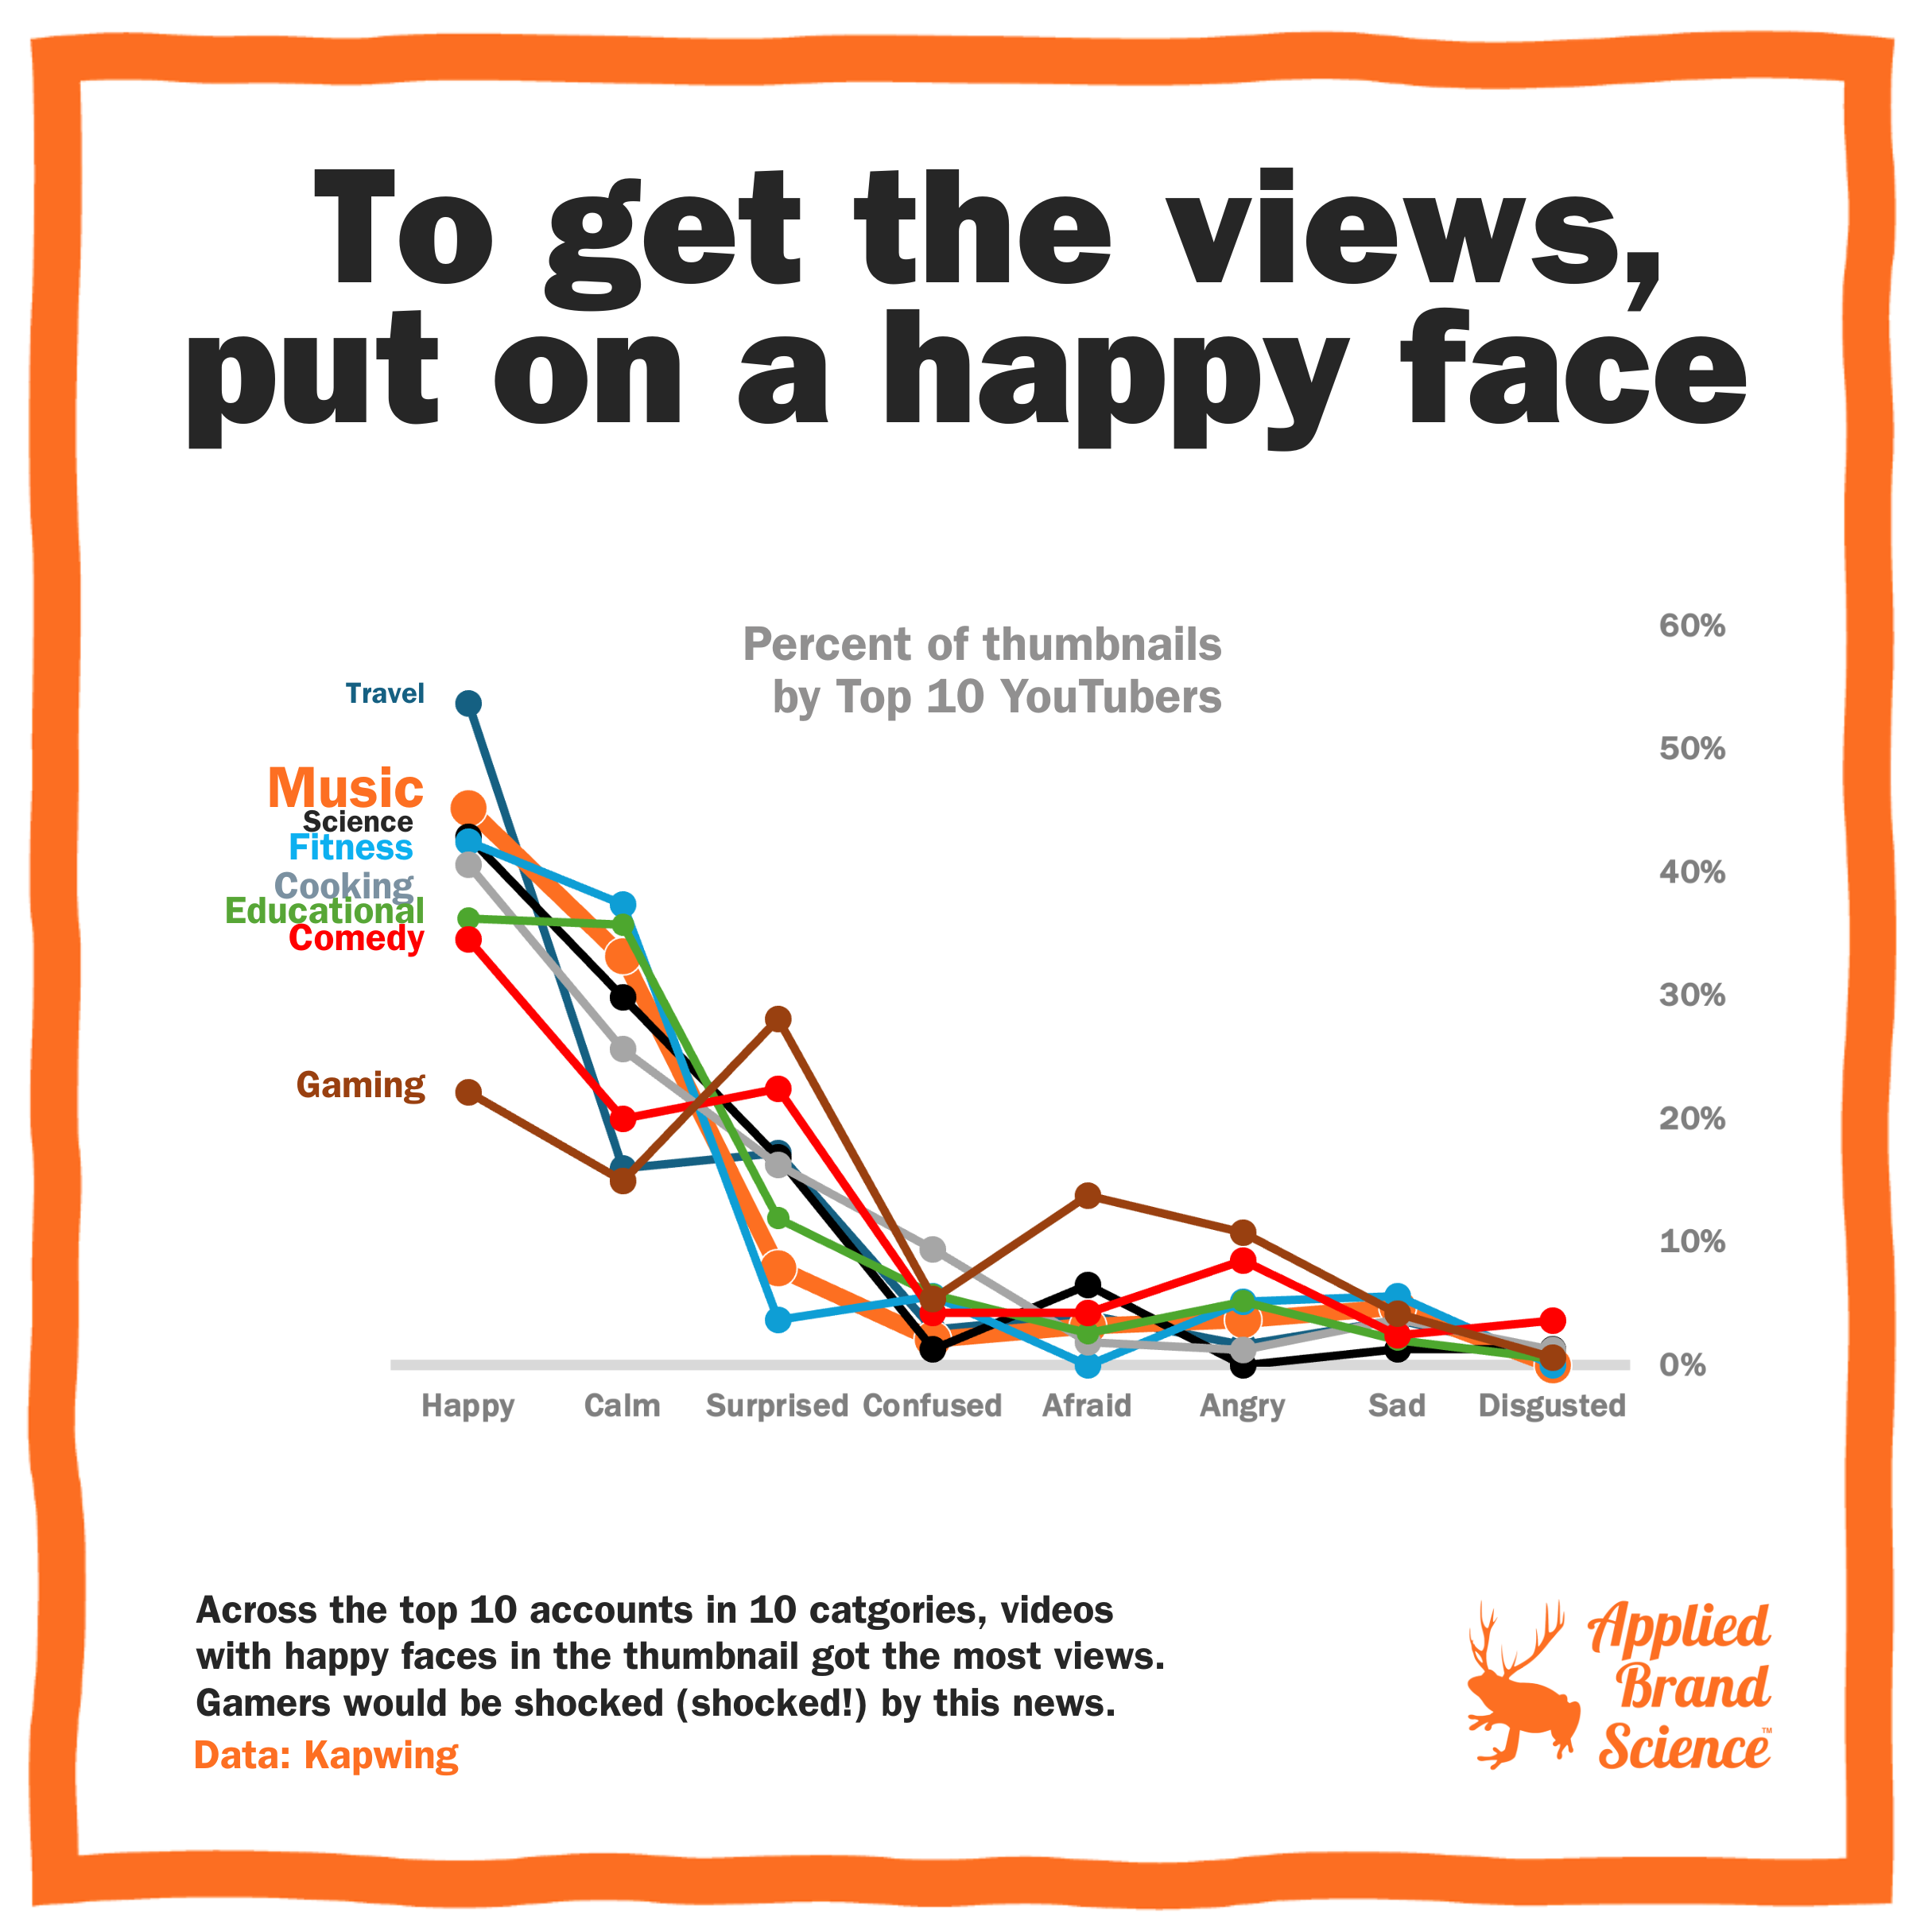
What face should you make on your YouTube Thumbail?
Does your facial expression change YouTube views? Yep—and the data shows which ones pull the most clicks.
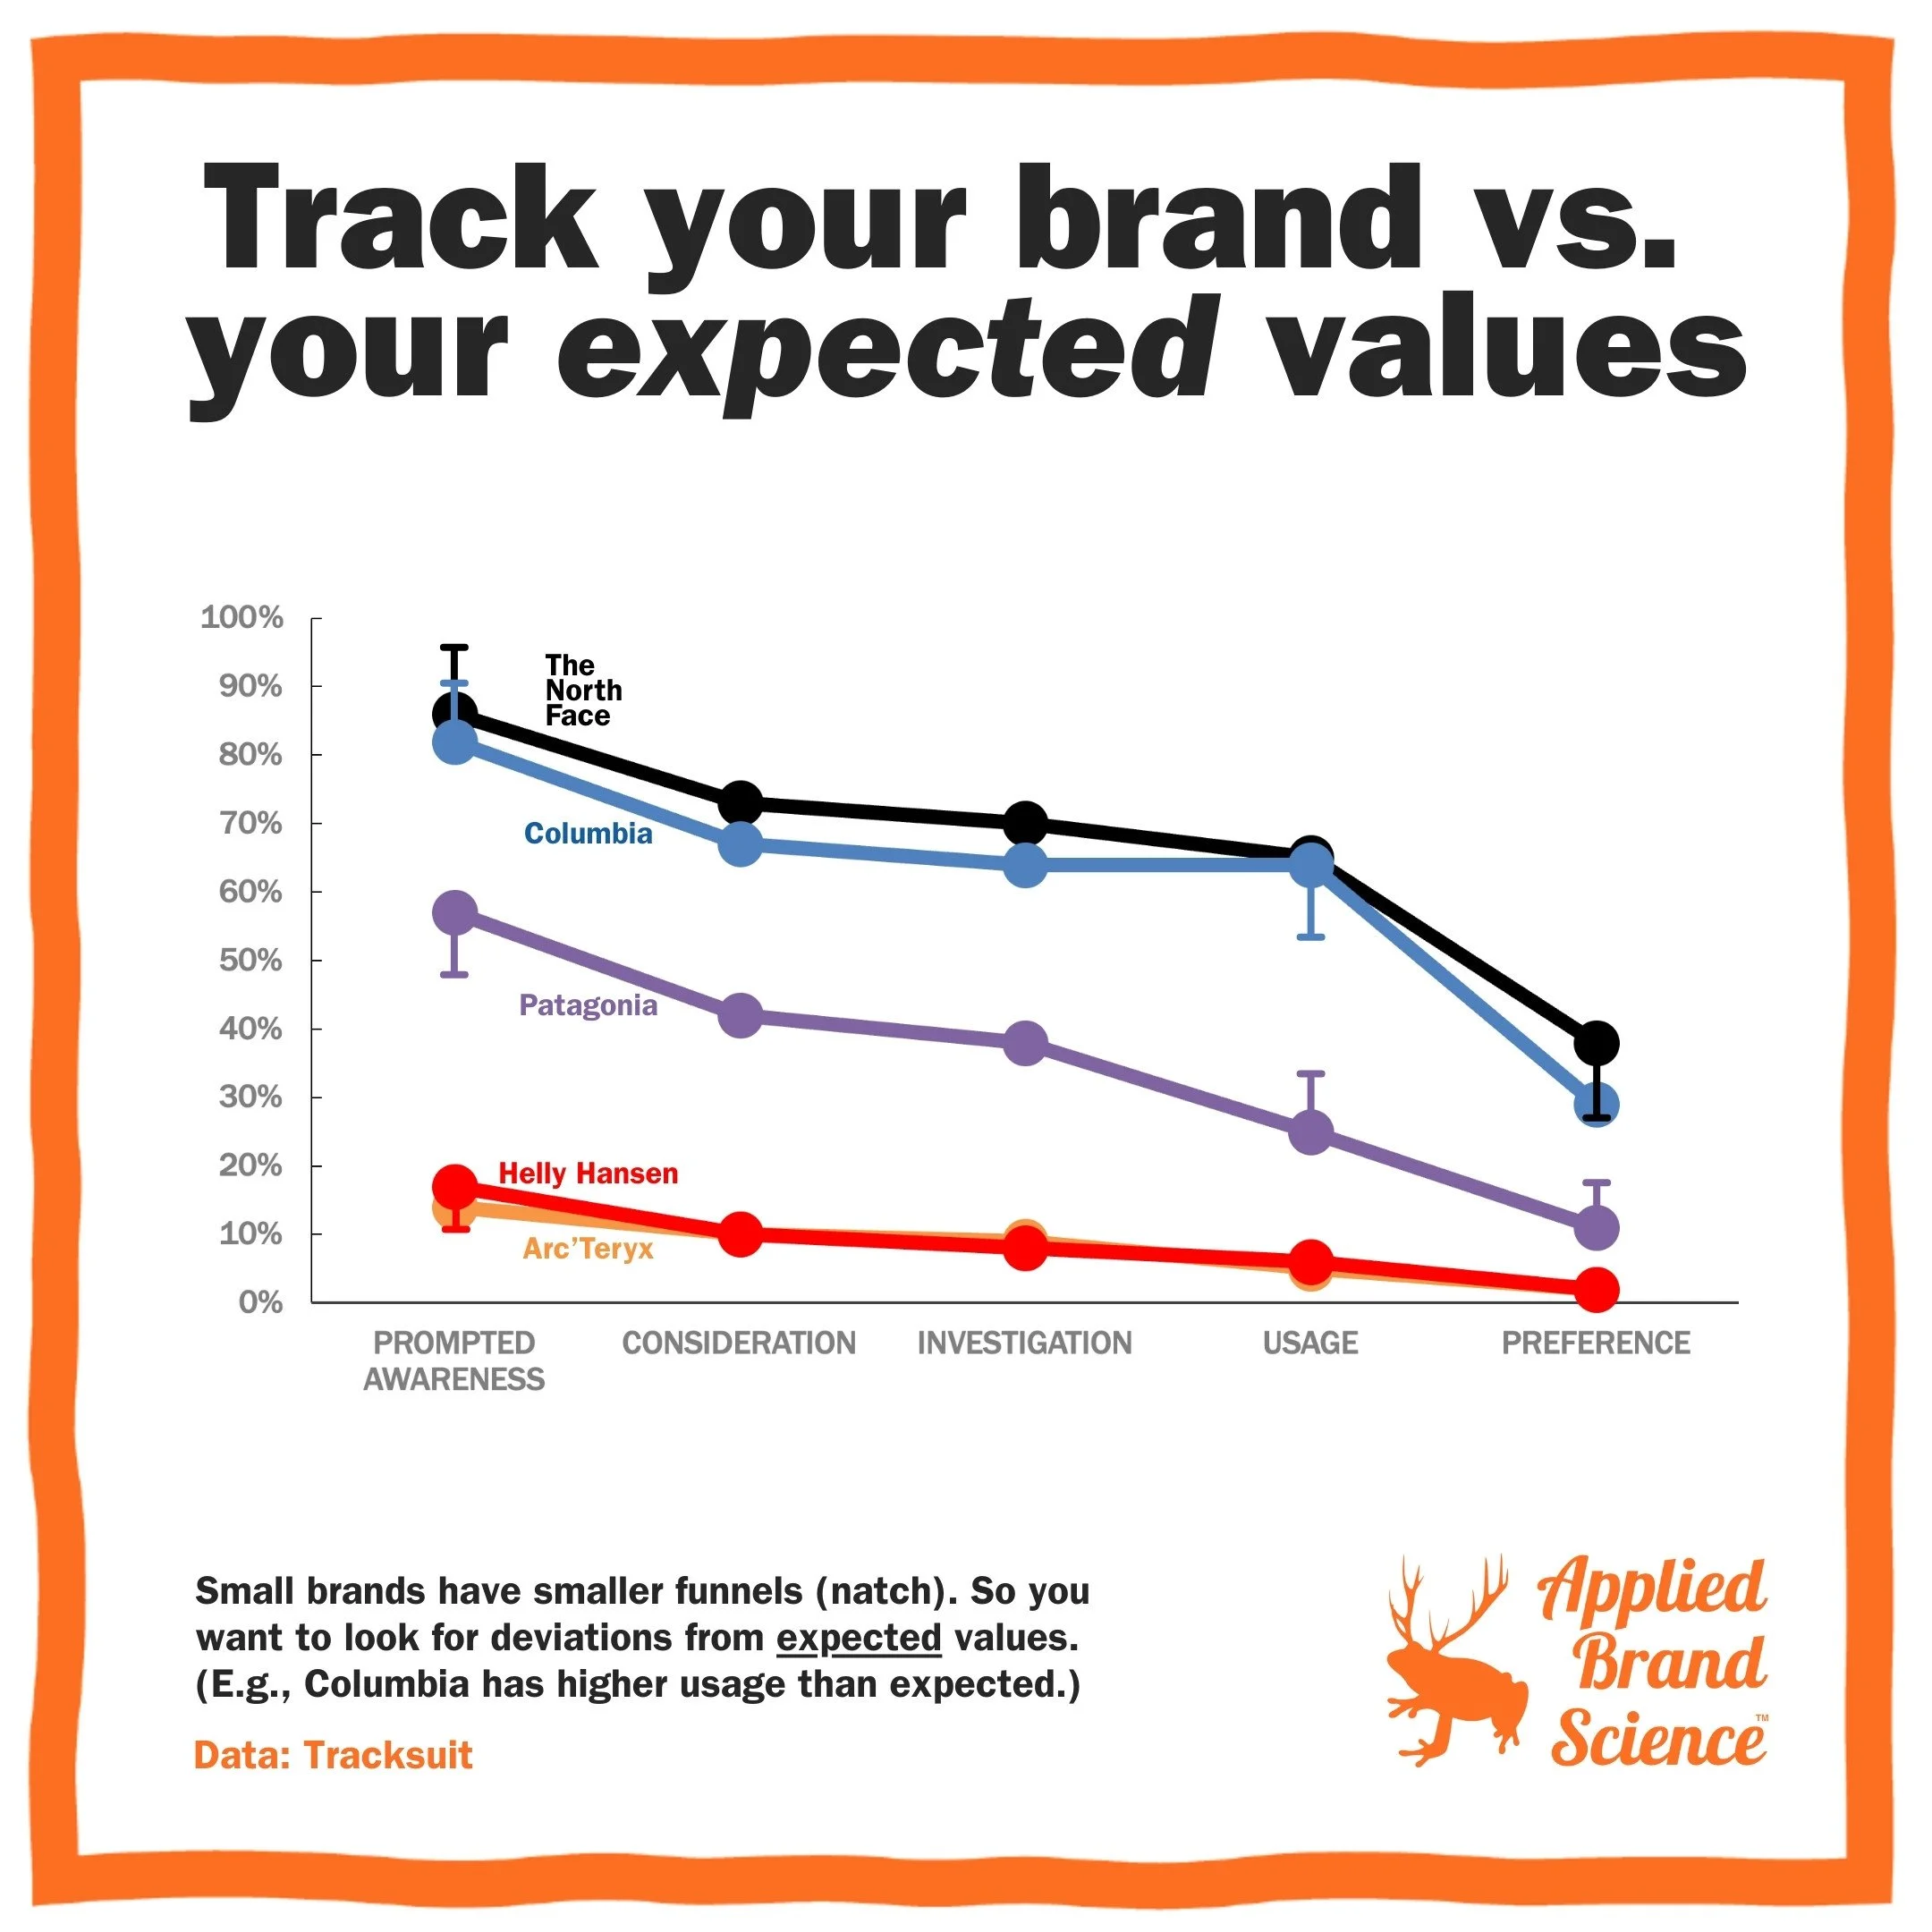
How should you interpret your purchase funnel?
Should you panic if your brand’s consideration rate is below average? Not really—and the North Face vs. Patagonia vs. Helly Hansen shows why.
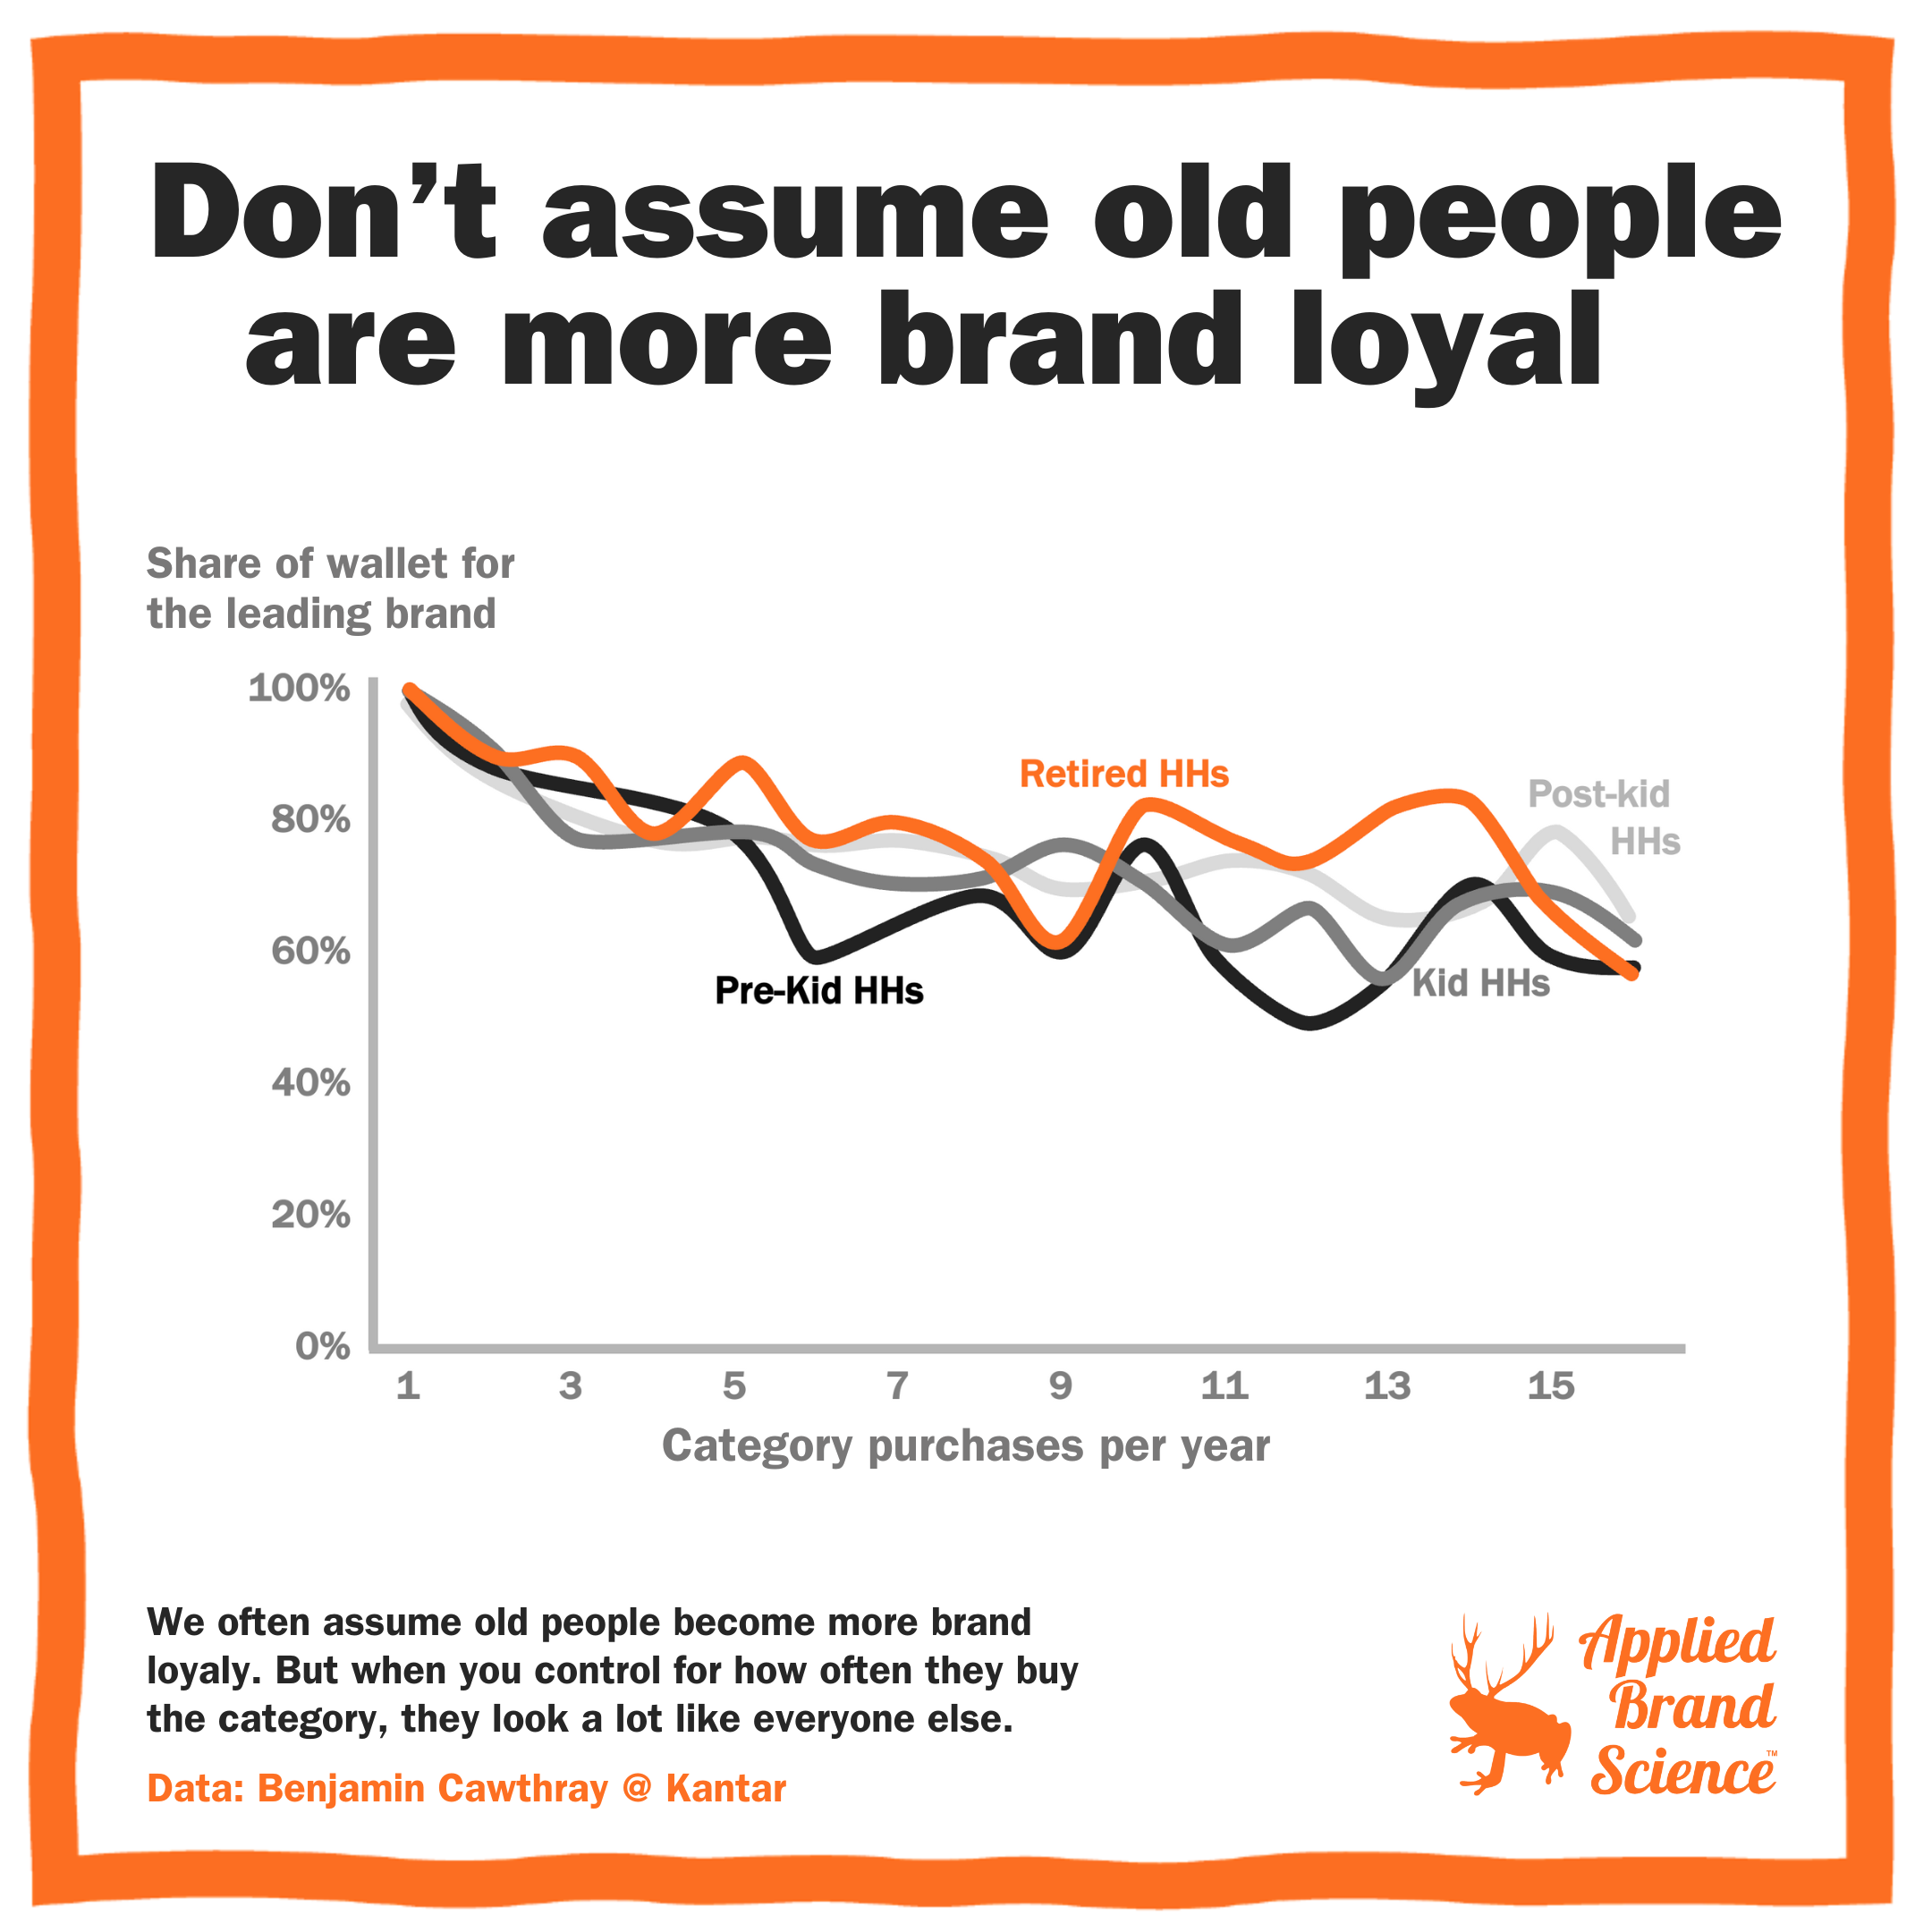
Are old people more brand loyal?
Kantar looked at 30,000 UK households to see how much of their wallet goes to one brand—and what that really says about ‘loyalty.’
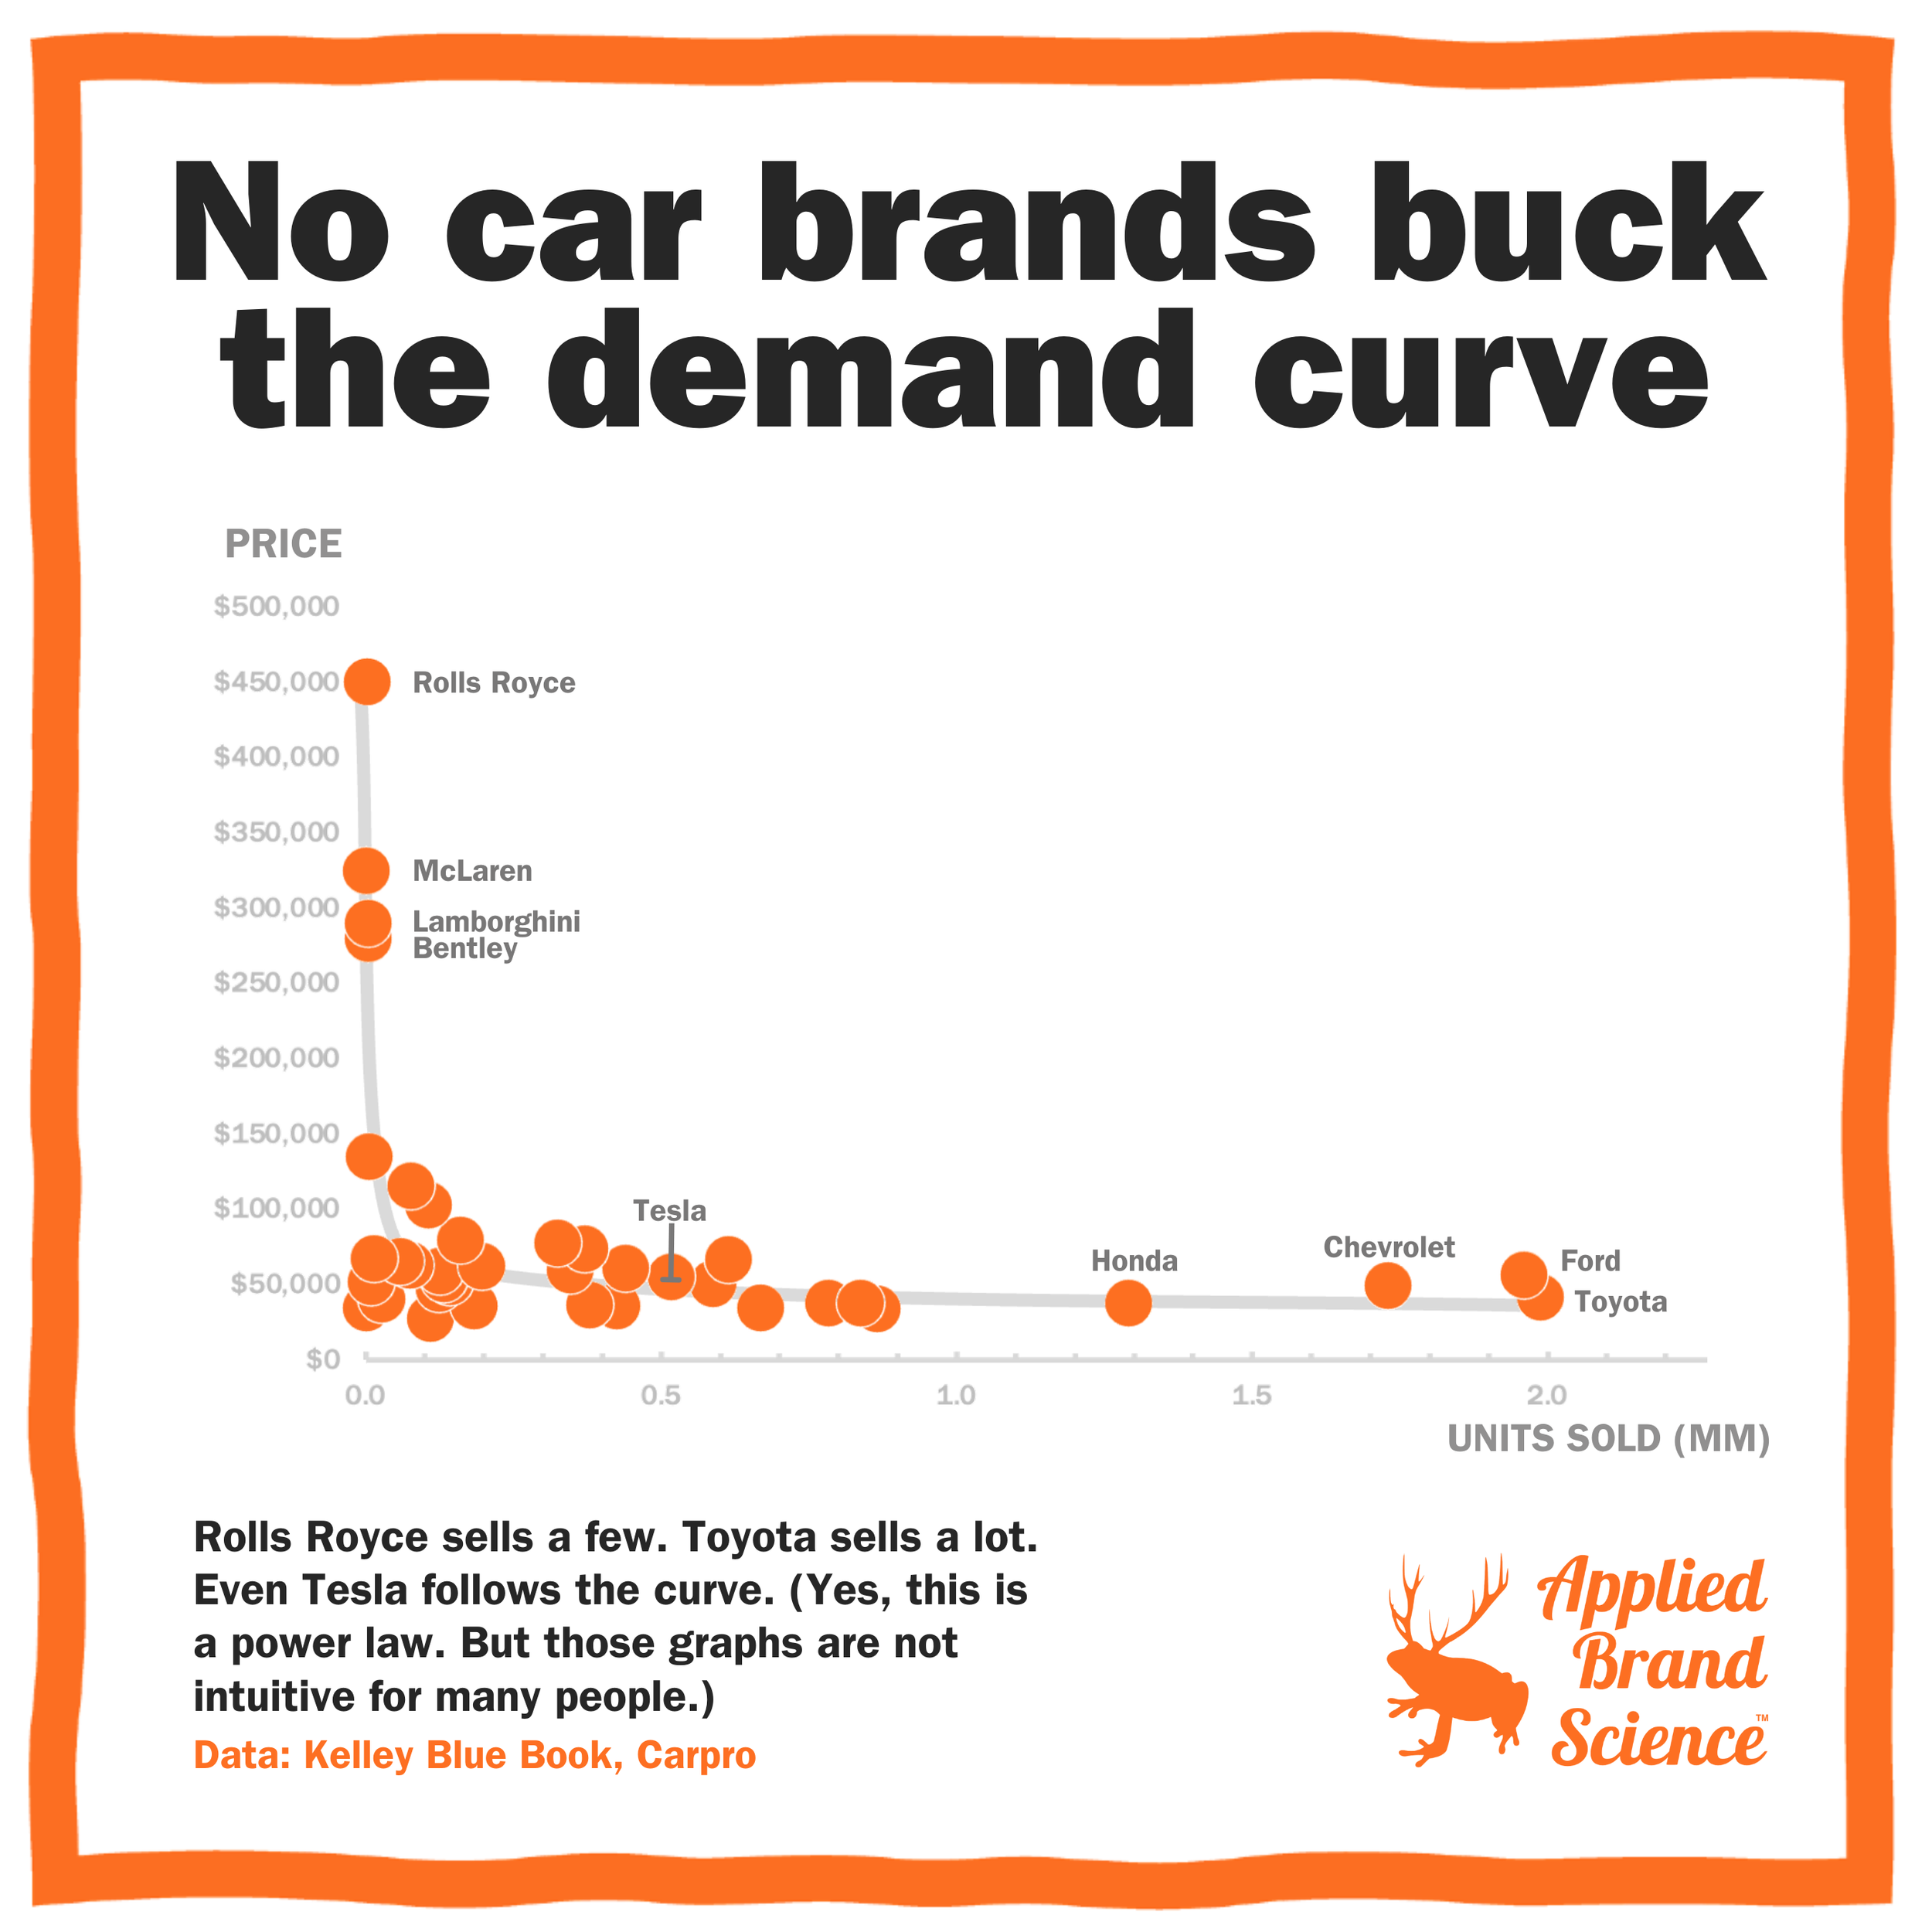
Does any car brand buck the Law of the Demand Curve?
Can a car be both high-priced and high-volume? The demand curve says no—and 200 years later, it still holds up.
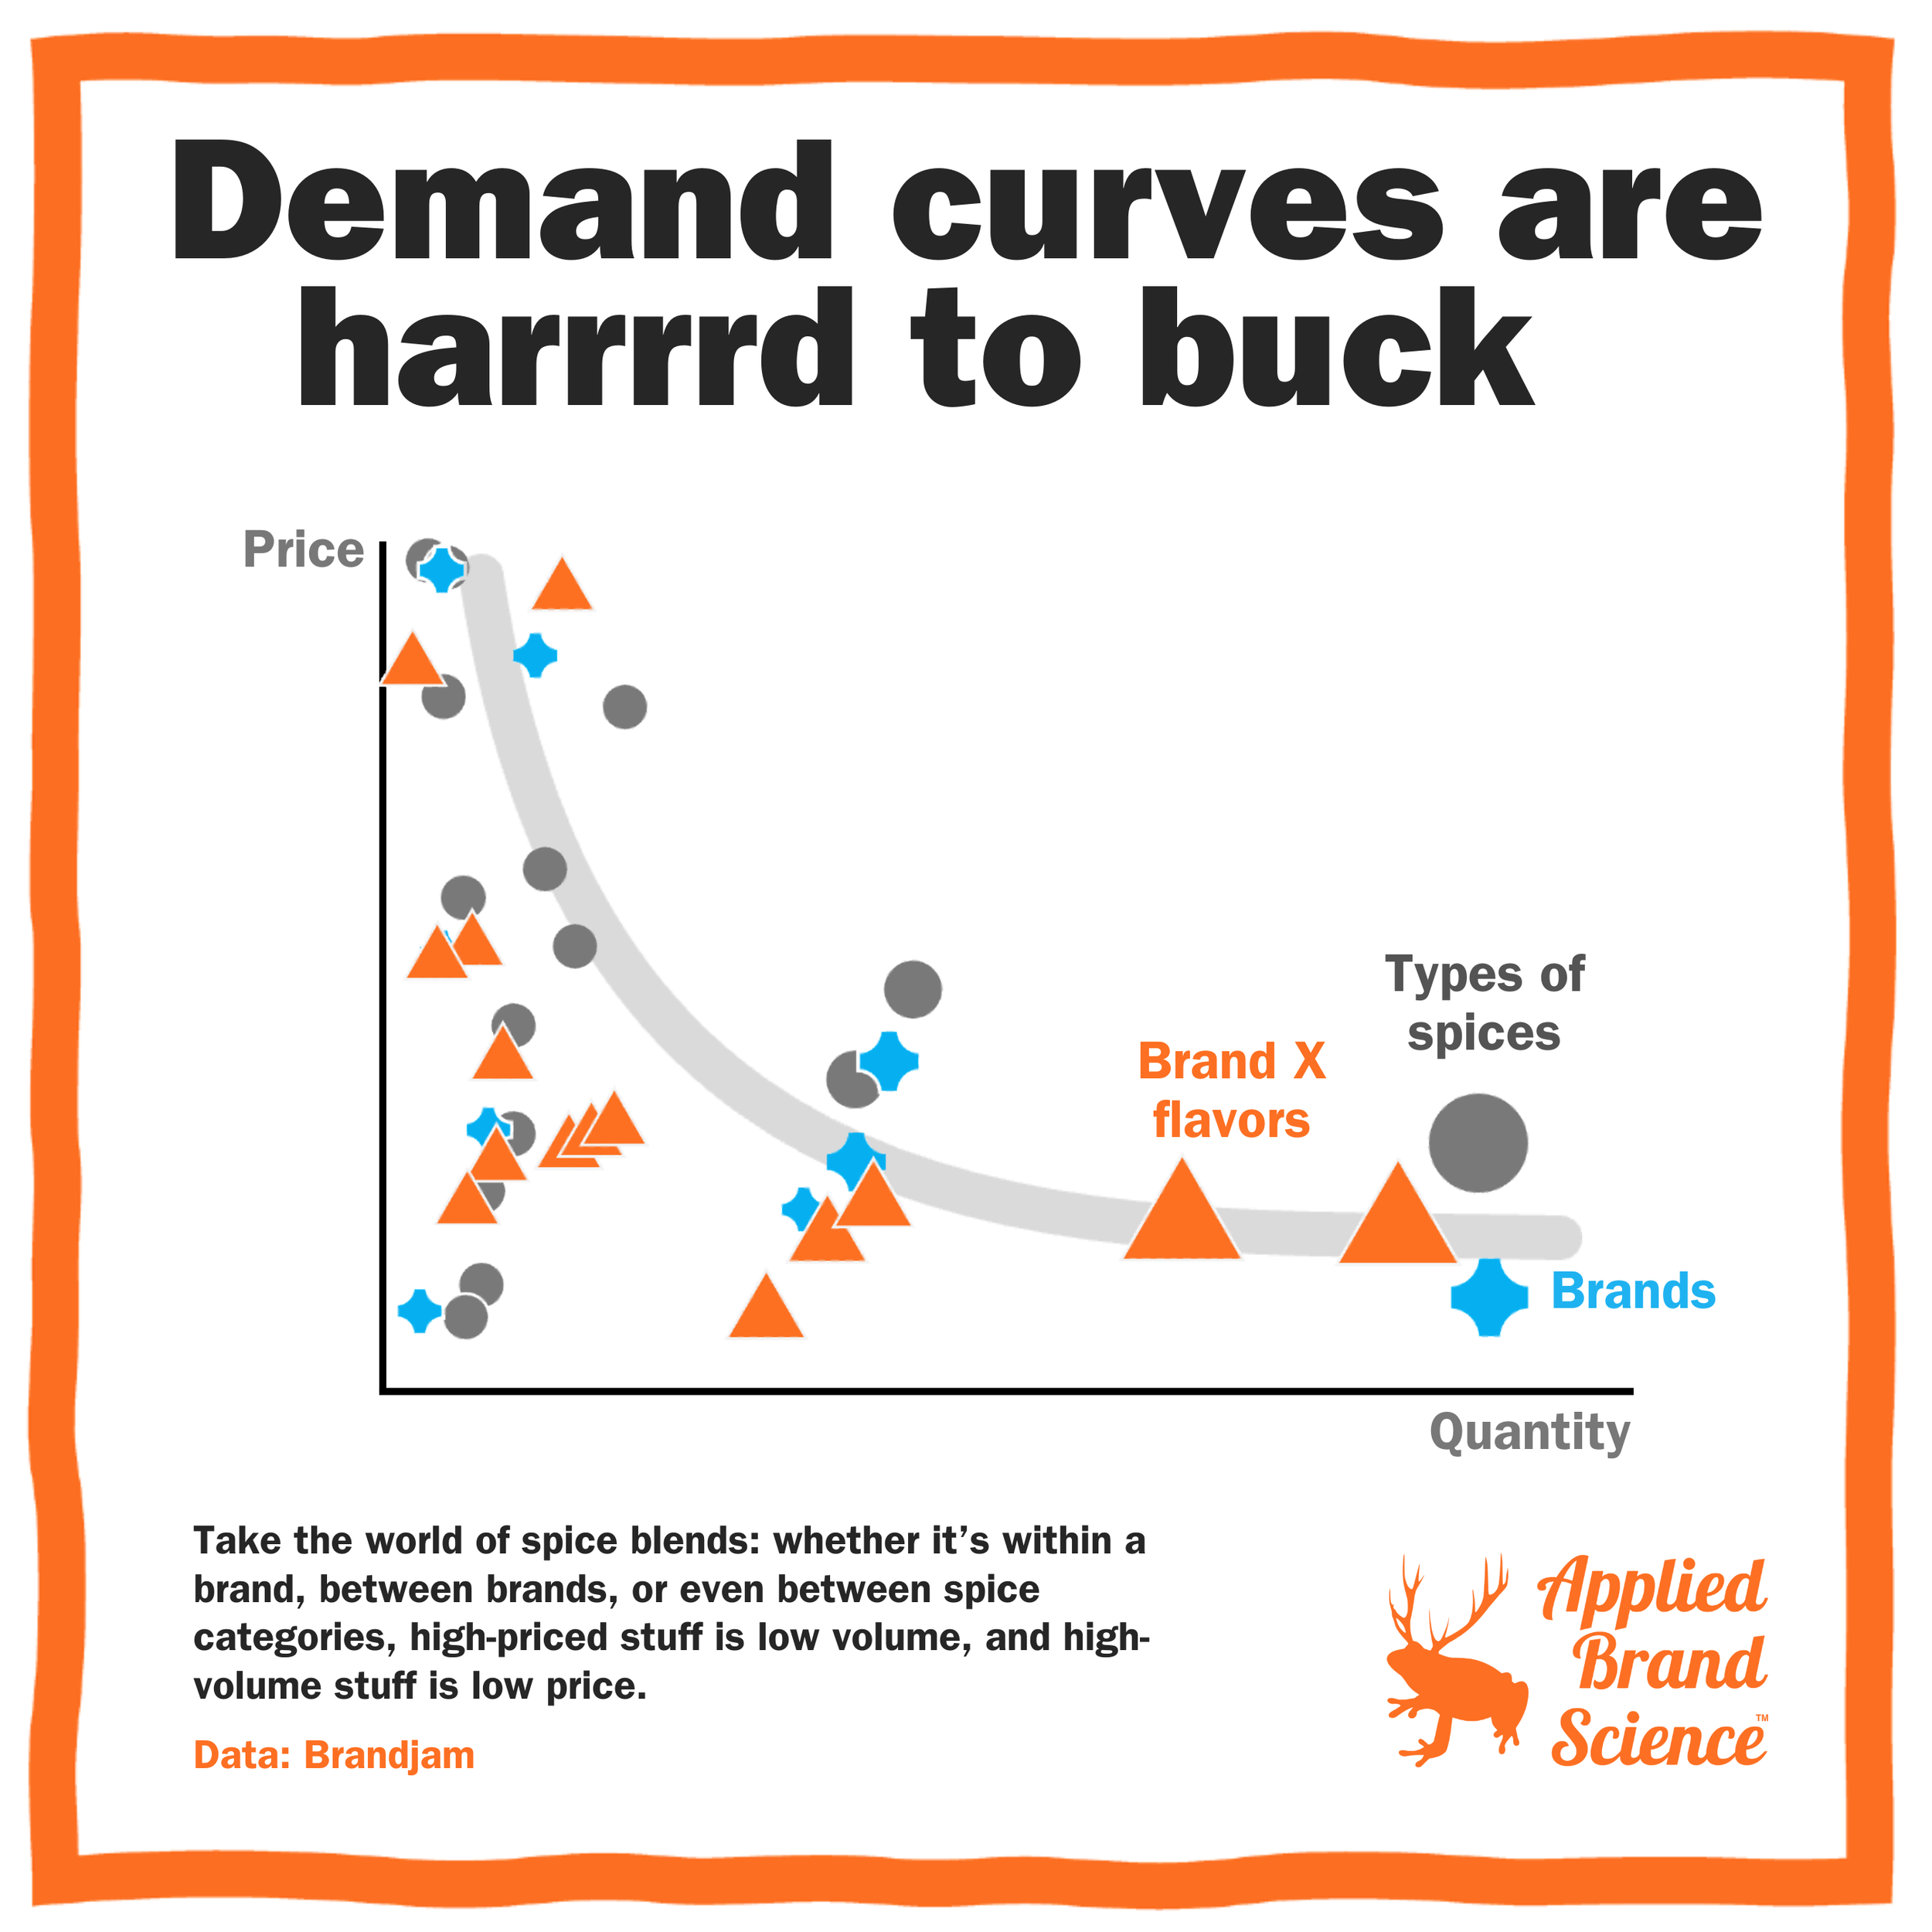
How hard is it to buck demand curves?
Can a product be both high-priced and high-volume? The demand curve—alive and well since 1838—says nope.
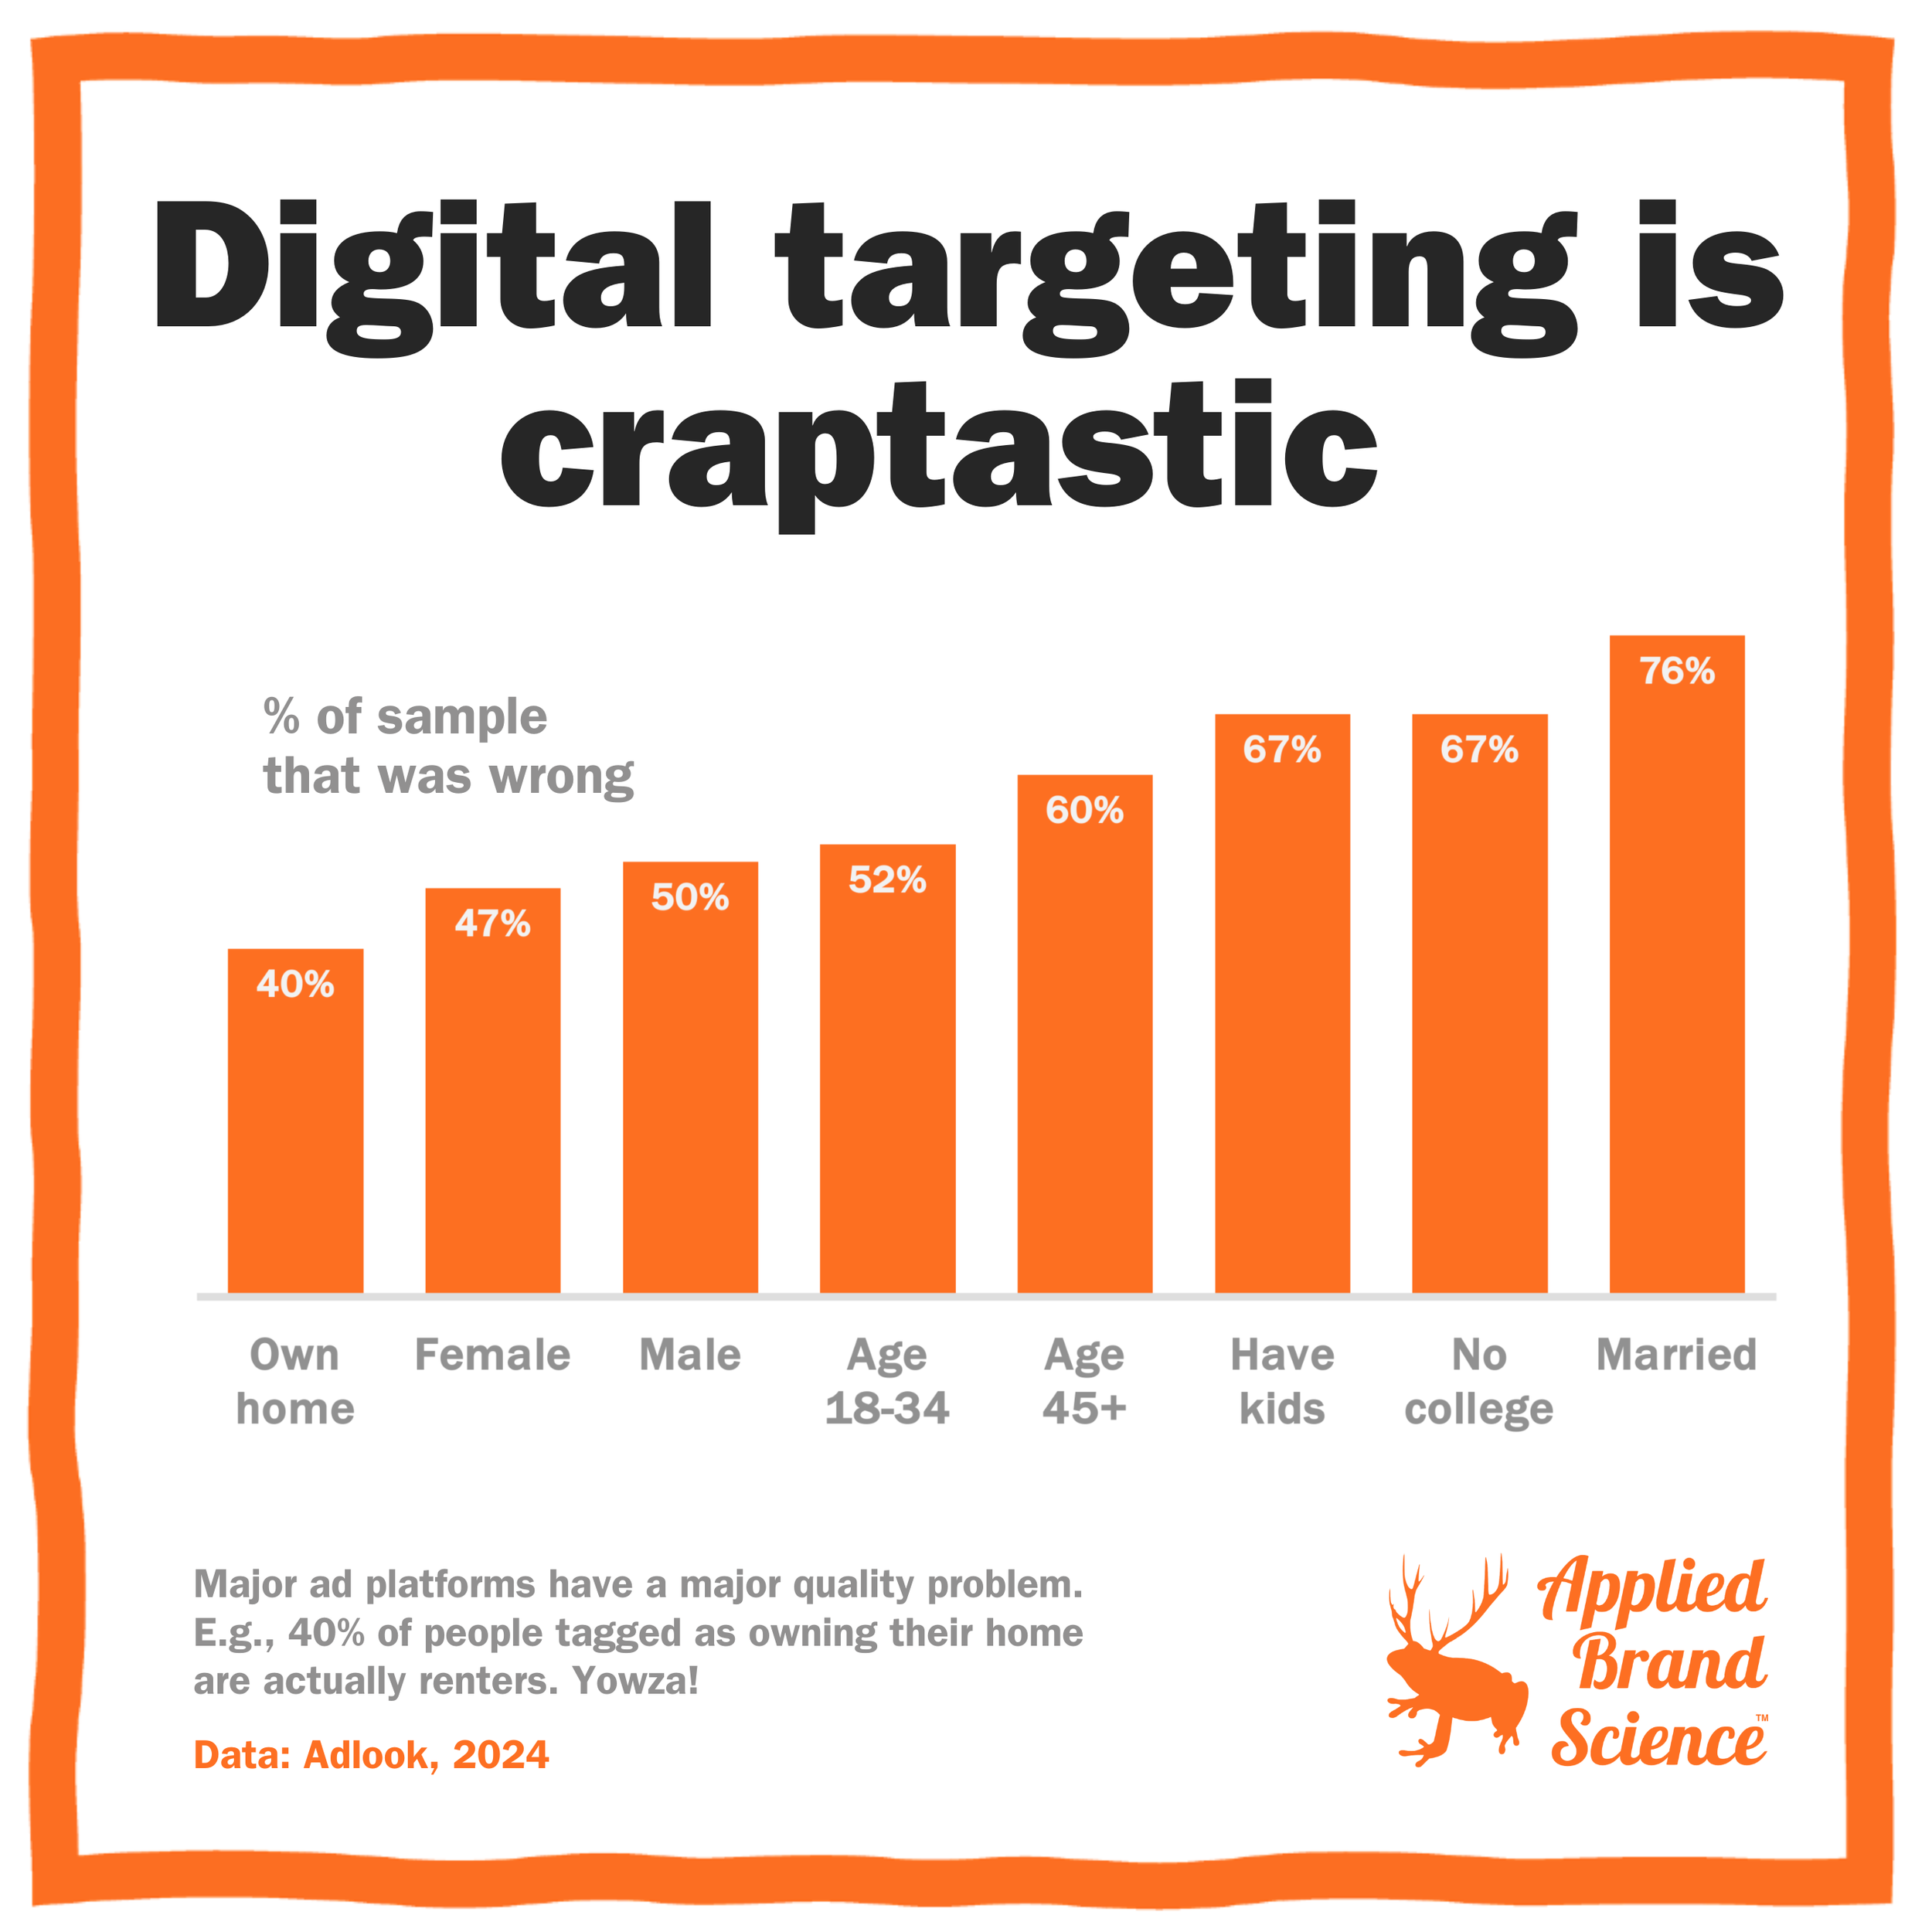
How crappy is digital targeting, really?
Digital ads promise hyper-targeting—but how good is the data really? Adlook put it to the test.
What Would an Applied Brand Science Podcast be Like?
It’s official: we’ve launched COVER BRAND—the podcast that digs into how brands really work (mascots, quirks, school colors and all).
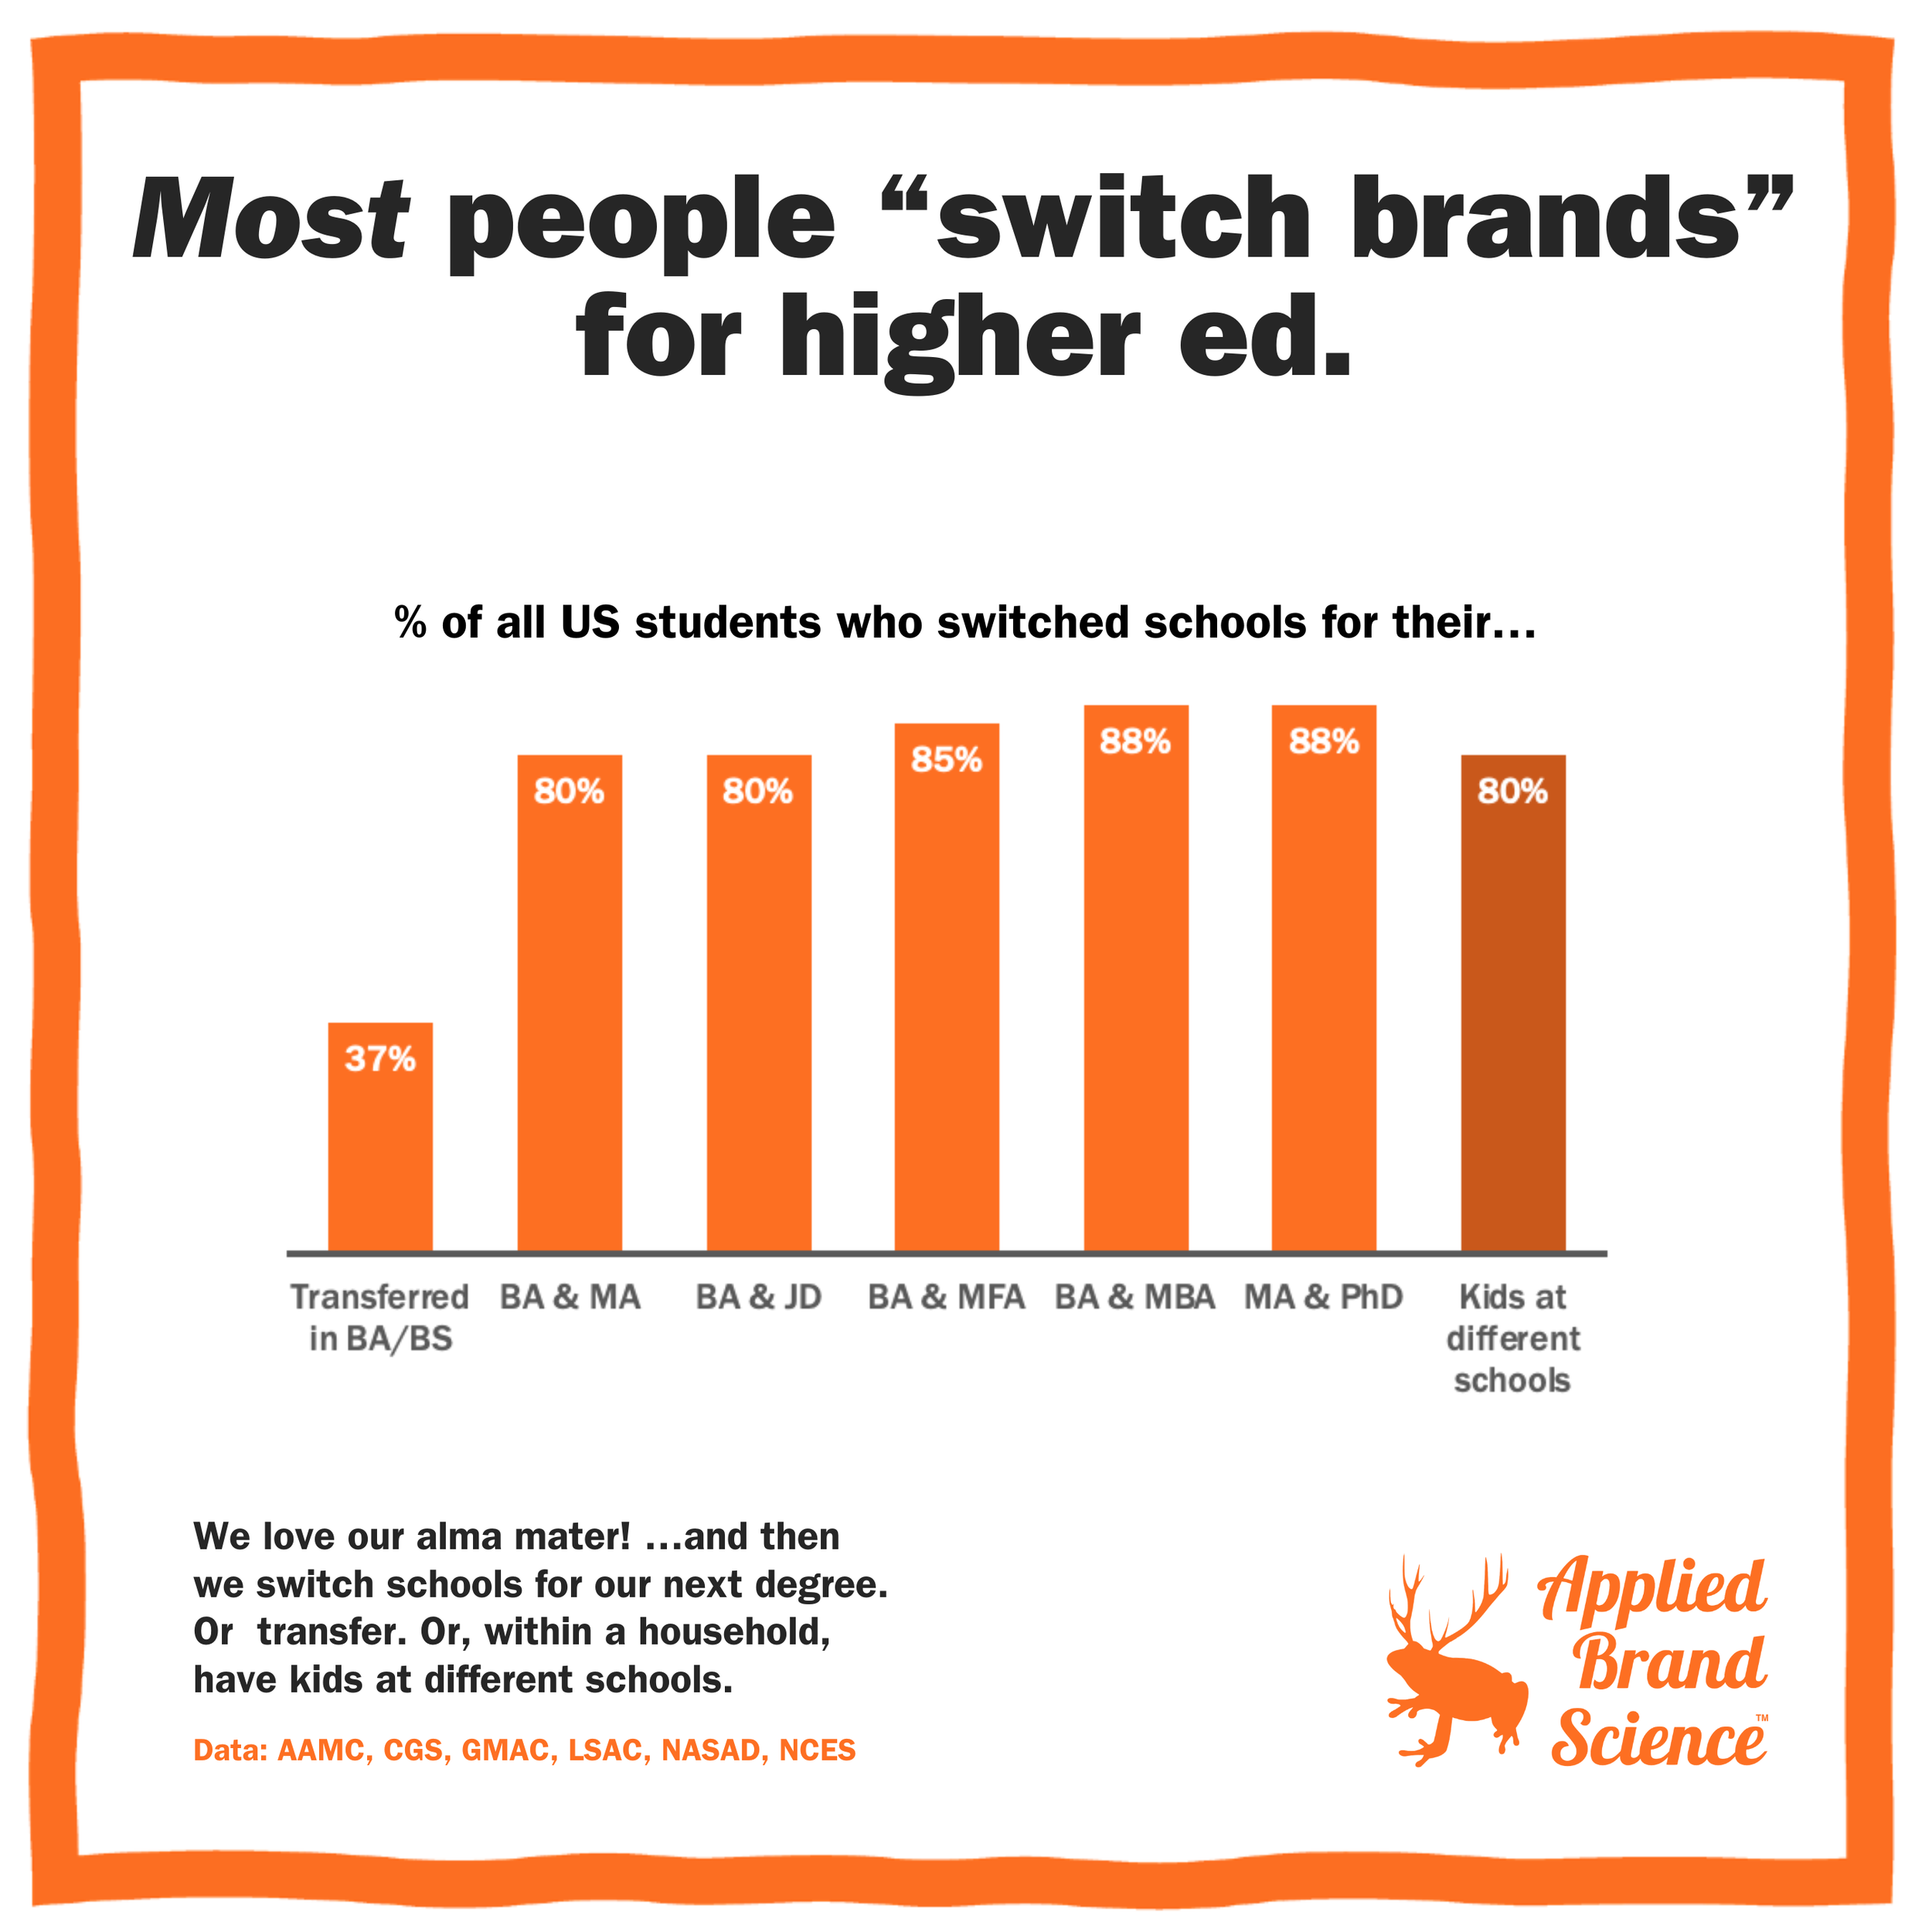
How “loyal” are people to their college or university?
We all bleed school colors—but what does brand loyalty really look like for colleges and universities?